ストキャスティクス・モメンタム指数とRSIに基づく定量戦略

1
Follow
1779
Followers
概要
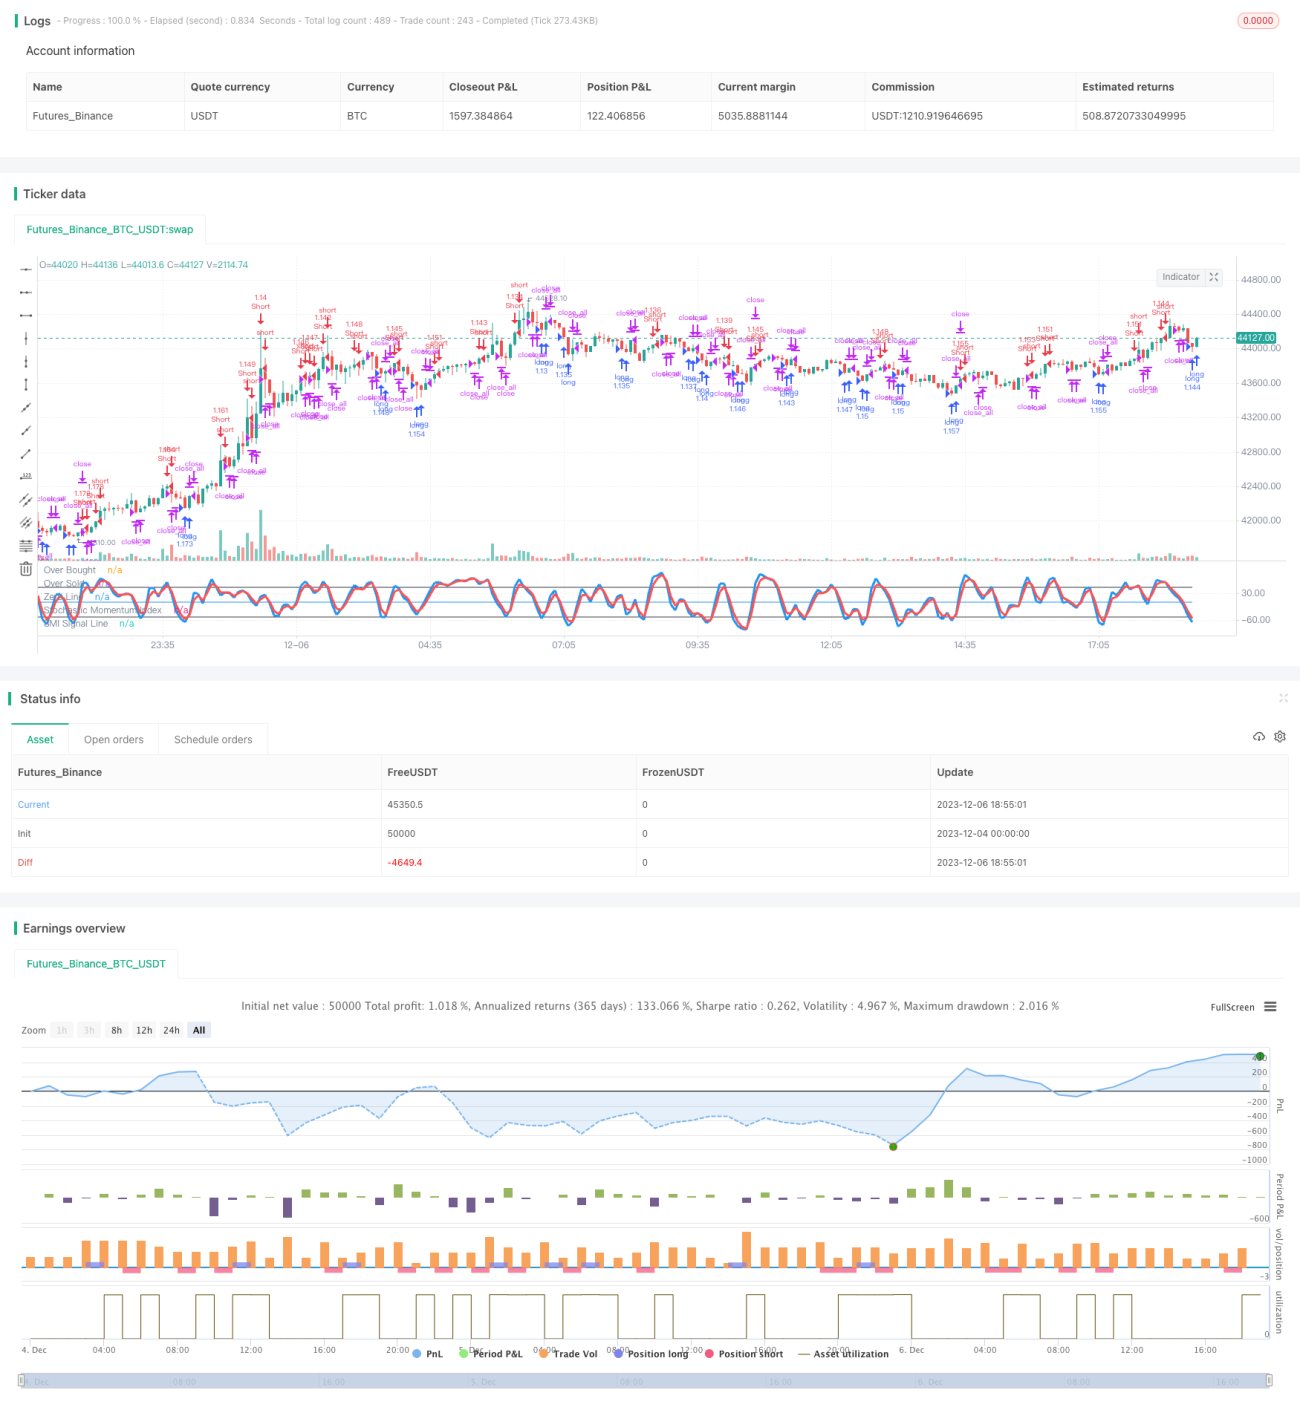
この戦略は主にストキャスティック・モメンタム・インデックス (SMI) と相対的な強さ指数 (RSI) の2つの指標に基づいています.さらに,カラーフィルターとK線実体フィルターが補助判断条件として追加されています.SMIとRSIの多空信号に基づいて,フィルター条件と組み合わせて取引信号を発信します.この戦略は,市場でショートラインの取引機会を効果的に発見できます.
戦略原則
この戦略の核心は,SMIとRSIの2つの指標に依存して判断する. SMIは,株式が過買過売かどうかを判断する,RSIは,株式の相対的な強さを判断する. 両方が同時に買取シグナルを与えるとき,買取操作を行う. 具体的ロジックは次のとおりである.
- SMI 超売り (下限以下) は,買取シグナルとして
- RSIが<unk>値を下回ると,買入のシグナルとなる.
- SMIの超売りとRSIが同時に相応の<unk>値を下回ったとき,買取シグナルを発信します.
- 空頭信号判断の論理は類似している.
さらに,この戦略は双信号モードを設定している.このモデルは,SMIとRSIが同時に信号を発行しなければならないことを要求し,取引を行う.これは,偽信号を効果的に減らすことができる.
さらに,この戦略には,カラーフィルターとK線実体フィルターが加えられている.この2つのフィルターには,K線実体が大きいこと,そして最後のK線の終了価格が開場価格より高いことが要求されている.これは,取引の偽突破をさらに回避することができる.
戦略的優位性
- SMIで超買いと超売れを判断し,RSIは比較的強いことを判断し,二重確認は偽信号を減らすことができます.
- バイシグナルモードを設定することで,無効取引を大幅に減らすことができます.
- カラーフィルターとK線実体フィルターは,偽突破を効果的にフィルタリングできる
- 戦略の実行ロジックは明確で簡潔です.
- パーメータのほとんどはカスタマイズできます.
リスクと最適化
- SMIとRSIが単独で使用されている場合,偽信号が多く発生する可能性があります.
- 双信号モードでは,パラメータが正しく設定されていない場合,より良い取引機会を逃す可能性があります.
- 異なる周期パラメータで戦略的収益をテストし,最適なパラメータの組み合わせを探します.
- シミュレーションまたは反測で評価可能な特定の<unk>値パラメータの設定
- フィルタを最適化する戦略を考慮する
要約する
この戦略はSMIとRSIの2つの指標の信号を統合し,二重確認によって取引指示を発行する.同時,カラーフィルターとK線エンティティフィルタをセットすると偽突破をフィルターすることができる.この戦略の動作ロジックはシンプルで明確であり,ほとんどのパラメータはカスタム設定できます.パラメータを調整することで,より良い戦略利益のパフォーマンスを得ることができます.
Source
Pine
Strategy parameters
Related strategies
Comment
All comments (0)
No data
- 1