
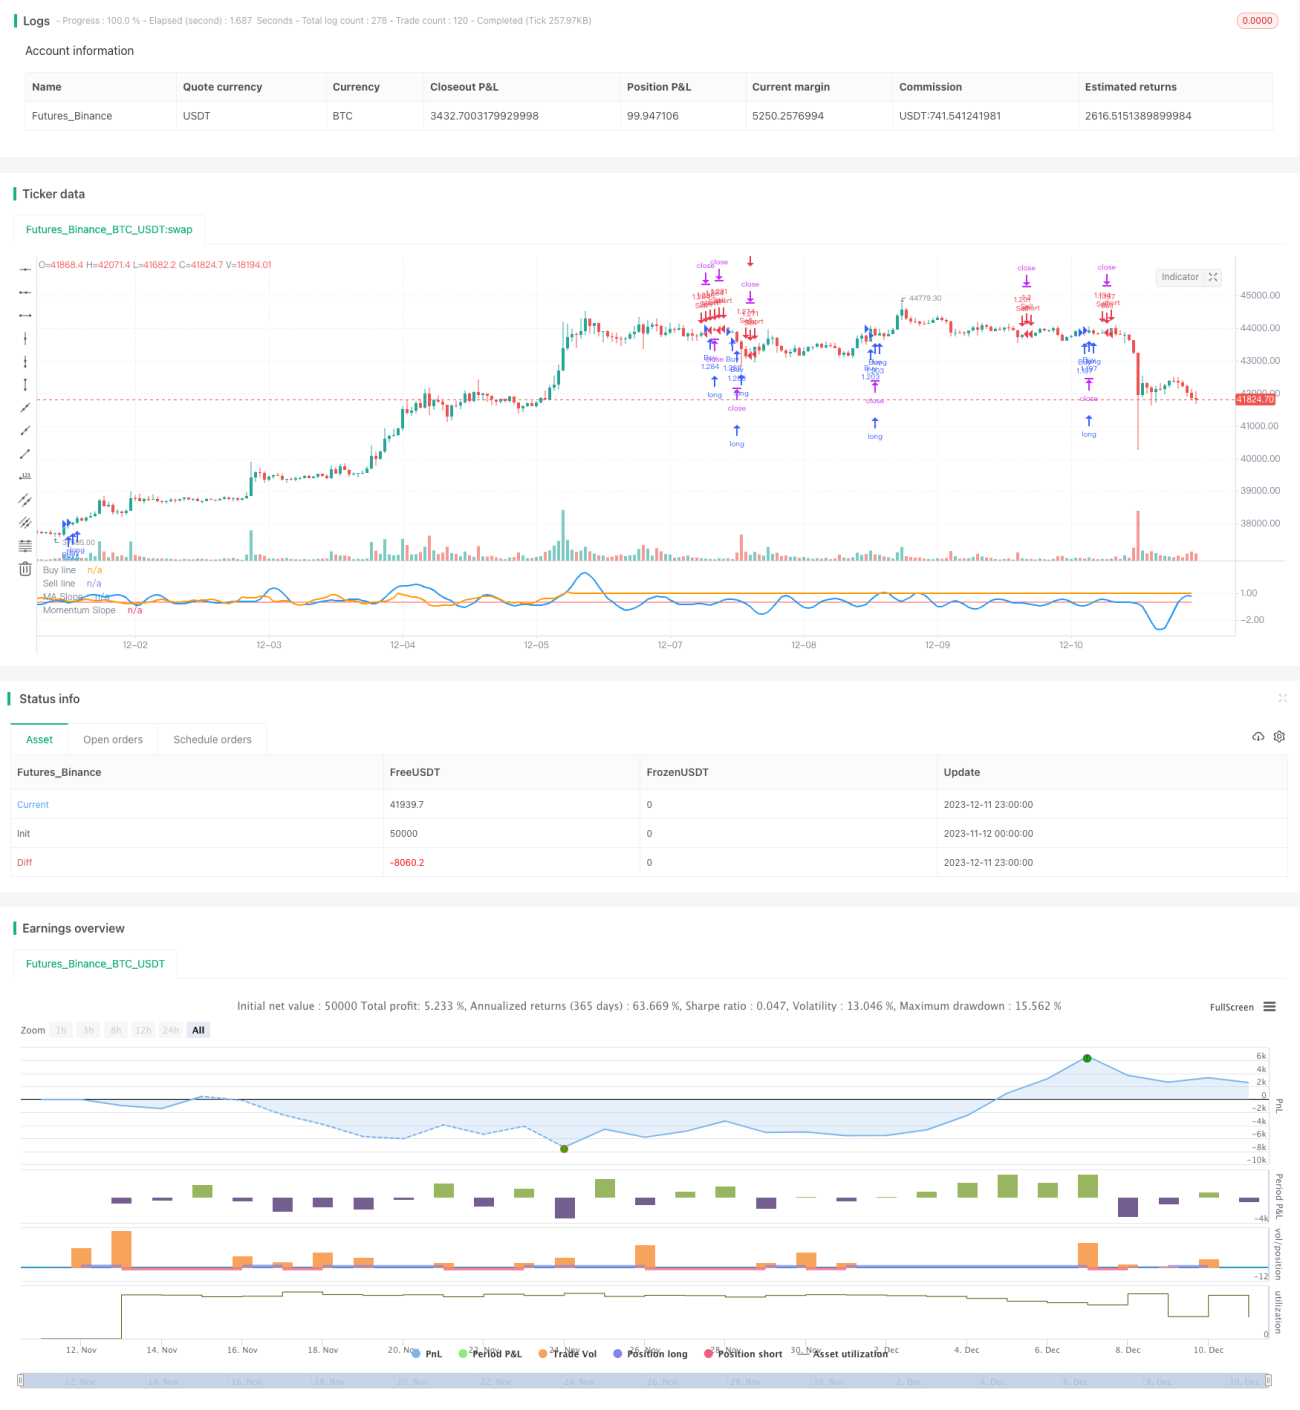
この戦略は,移動平均 ((MA) の斜率と動量指標の斜率を利用して取引決定を行う. MAの斜率と動量指標の斜率を設定された値と比較し,両方の斜率が値を超えると取引シグナルを生成する. この戦略には,低波動のフィルターが含まれ,市場の波動が低いときに異なるMAを生成するシグナルを使用する.
この戦略の核心は,2つの斜率曲線を比較することです. まず,MAと動力指数の斜率を計算します.斜率は曲線の変化速度と方向を反映します.そして,2つの値を使用し,両斜率曲線がそれぞれそれぞれの値を超えると取引シグナルを生成します.
例えば,MAの斜率と動力の斜率の両方が上線を超えると,買入信号が生成され,両曲線が下線を突破すると,売出信号が生成される.これにより,部分的な偽信号をフィルターすることができる.
低波動フィルターは,長期MAを使用して市場の波動性を判断する.波動性が低いとき,異なるパラメータのMAを使用して取引信号を生成し,異なる市場状態に適応する.
この戦略には以下の利点があります.
ダブルフィルターを使用して取引信号を設定し,部分的なノイズをフィルターして信号の質を向上させる.
低波動のフィルターは,戦略を異なる市場状況に適応させ,弾力性を持つようにします.
異なるパラメータを高度にカスタマイズすることができ,異なる品種に最適化することができます.
複塗料なしの機能を含み,結果に対する曲線適合の影響を軽減する.
この戦略にはいくつかのリスクがあります.
双重フィルタリングは,部分的に真信号をフィルタリングし,見逃したチャンスを引き起こす可能性がある。パラメータの調整によって最適化することができる。
低波のフィルターで,値の判定は,慎重にテストして決定する必要があります.パラメータが不適切であれば,信号偏差が発生する可能性があります.
MAと動量指数パラメータの設定は,特定の品種に最適化が必要で,全市場の一般的なパラメータを決定することは困難である.
塗料なし機能は,反測曲線適合問題を完全に回避することはできません.实体ディスク効果はまだ検証する必要があります.
高度なカスタムパラメータはパラメータ空間を複雑化し,最適化が困難になる.
この戦略は以下の方向から最適化できます.
複数の種類のMAと運動指標の組み合わせをテストし,最も適合する指標を見つけます.
MAと動量指標の長さのパラメータを最適化し,遅延とノイズをバランスする.
斜率計算のパラメータを最適化して,より安定した指標の組み合わせを見つける.
低波動性の指標とパラメータをテストし,弾力性を高める.
異なる品種と周期でテストし,最適の適用範囲を探します.
パラメータの自己適応メカニズムを構築し,手動最適化作業量を減らす.
この戦略は,全体として非常に柔軟でカスタマイズ可能な二重MA戦略である.それは,価格と動量情報を参照して同時に意思決定を行い,偽の信号を効果的にフィルターすることができます.低波動フィルターは,戦略をより柔軟に,市場の変化に適応できるようにします.
パラメータの最適化と指標選択の改善により,この戦略は実盤での適用を考慮すべき選択肢にすることができます.それはMAと動態指標を利用して取引決定を行うための参考テンプレートを提供します.
/*backtest
start: 2023-11-12 00:00:00
end: 2023-12-12 00:00:00
period: 1h
basePeriod: 15m
exchanges: [{"eid":"Futures_Binance","currency":"BTC_USDT"}]
*/
// This source code is subject to the terms of the Mozilla Public License 2.0 at https://mozilla.org/MPL/2.0/
// © Allenlk
//@version=4
strategy("DRSI DMA Scalping Strategy", shorttitle="DRSIDMA", overlay=false, initial_capital=1000, pyramiding=2, default_qty_type=strategy.percent_of_equity, default_qty_value=100)
//Inputs
matype = input(7, minval=1, maxval=8, title="1=SMA, 2=EMA, 3=WMA, 4=HullMA, 5=VWMA, 6=RMA, 7=TEMA, 8=Tilson T3", group="Moving Average")
masrc = input(close, title="MA Source", group="Moving Average")
malen = input(5, title="Moving Average Length - LookBack Period", group="Moving Average")
factorT3 = input(defval=7, title="Tilson T3 Factor - *.10 - so 7 = .7 etc.", minval=0, group="Moving Average")
maderiv = input(3, title="MA Slope Lookback", minval=1, group="Moving Average")
masmooth = input(5, title="MA Slope Smoothing", minval=1, group="Moving Average")
momtype = input(3, minval=1, maxval=3, title="1=RSI, 2=CCI, 3=RSI/ROC", group="Momentum Moving Average")
momsrc = input(close, title="Momentum Source", group="Momentum Moving Average")
momlen = input(3, title="Momentum Length", minval=1, group="Momentum Moving Average")
momderiv = input(8, title="Momentum Slope Lookback", minval=1, group="Momentum Moving Average")
momsmooth = input(7, title="Momentum Slope Smoothing", minval=1, group="Momentum Moving Average")
higherTf = input("1", title="Higher timeframe?", type = input.resolution, group="Time Resolution")
higherTfmult = input(130, title="MA Slope multiplier for Alternate Resolutions (Make the waves of the blue line similar size as the orange line)", group="Time Resolution")
buffup = input(0.02, title="Buy when both slopes cross this line", step=0.01, group="Buy and Sell Threshold")
bufflow = input(-0.03, title="Sell when both slopes cross this line", step=0.01, group="Buy and Sell Threshold")
lowVolMALength = input(28, title="Big MA Length", minval=1, group="Low Volatility Function")
MAlength = input(10, title="Low Volatility Moving Average Length", minval=1, group="Low Volatility Function")
MAThresh = input(0.05, title="Low Volatility Buy and Sell Threshold", step=0.01, group="Low Volatility Function")
Volminimum = input(2.5, title="Minimum volatility to trade", minval=0, step=0.01, group="Low Volatility Function")
//Low Volatility Function
//When Volatility is low refer to the slope of a long moving average
low_vol_MA = sma(close, lowVolMALength)
low_vol_down = (low_vol_MA[3] - low_vol_MA[1]) > MAThresh
low_vol_up = (low_vol_MA[3] - low_vol_MA[1]) < MAThresh * -1
percent_volatility = (1 - (low / high)) * 100
chng_MA = sma(percent_volatility, MAlength)
bad_vol = chng_MA < Volminimum
//No repaint function
nrp_funct(_symbol, _res, _src) => security(_symbol, _res, _src[barstate.isrealtime ? 1 : 0])
//hull ma definition
hullma = wma(2*wma(masrc, malen/2)-wma(masrc, malen), round(sqrt(malen)))
//TEMA definition
ema1 = ema(masrc, malen)
ema2 = ema(ema1, malen)
ema3 = ema(ema2, malen)
tema = 3 * (ema1 - ema2) + ema3
//Tilson T3
factor = factorT3 *.10
gd(masrc, malen, factor) => ema(masrc, malen) * (1 + factor) - ema(ema(masrc, malen), malen) * factor
t3(masrc, malen, factor) => gd(gd(gd(masrc, malen, factor), malen, factor), malen, factor)
tilT3 = t3(masrc, malen, factor)
//MA Type
avg = matype == 1 ? sma(masrc,malen) : matype == 2 ? ema(masrc,malen) : matype == 3 ? wma(masrc,malen) : matype == 4 ? hullma : matype == 5 ? vwma(masrc, malen) : matype == 6 ? rma(masrc,malen) : matype == 7 ? 3 * (ema1 - ema2) + ema3 : tilT3
//MA Slope Percentage
DeltaAvg = (avg / avg[maderiv]) - 1
SmoothedAvg = sma(DeltaAvg, masmooth)
MAout = nrp_funct(syminfo.tickerid, higherTf, SmoothedAvg) * higherTfmult
//Momentum indicators
Momentum = momtype == 1 ? rsi(momsrc, momlen) : momtype == 2 ? cci(momsrc, momlen) : momtype == 3 ? rsi(roc(momsrc,momlen),momlen) : na
//Momentum Slope Percentage
Deltamom = (Momentum / Momentum[momderiv]) - 1
SmoothedMom = sma(Deltamom, momsmooth)
Momout = nrp_funct(syminfo.tickerid, higherTf, SmoothedMom)
//Plottings
plot(buffup, color=color.green, title="Buy line")
plot(bufflow, color=color.red, title="Sell line")
plot(MAout, color=color.blue, linewidth=2, title="MA Slope")
plot(Momout, color=color.orange, linewidth=2, title="Momentum Slope")
longCondition = bad_vol ? low_vol_up : MAout > buffup and Momout > buffup
if (longCondition)
strategy.entry("Buy", strategy.long)
shortCondition = bad_vol ? low_vol_down : MAout < bufflow and Momout < bufflow
if (shortCondition)
strategy.entry("Sell", strategy.short)