ボリンジャーバンドデュアル移動平均追跡グリッド戦略

概要
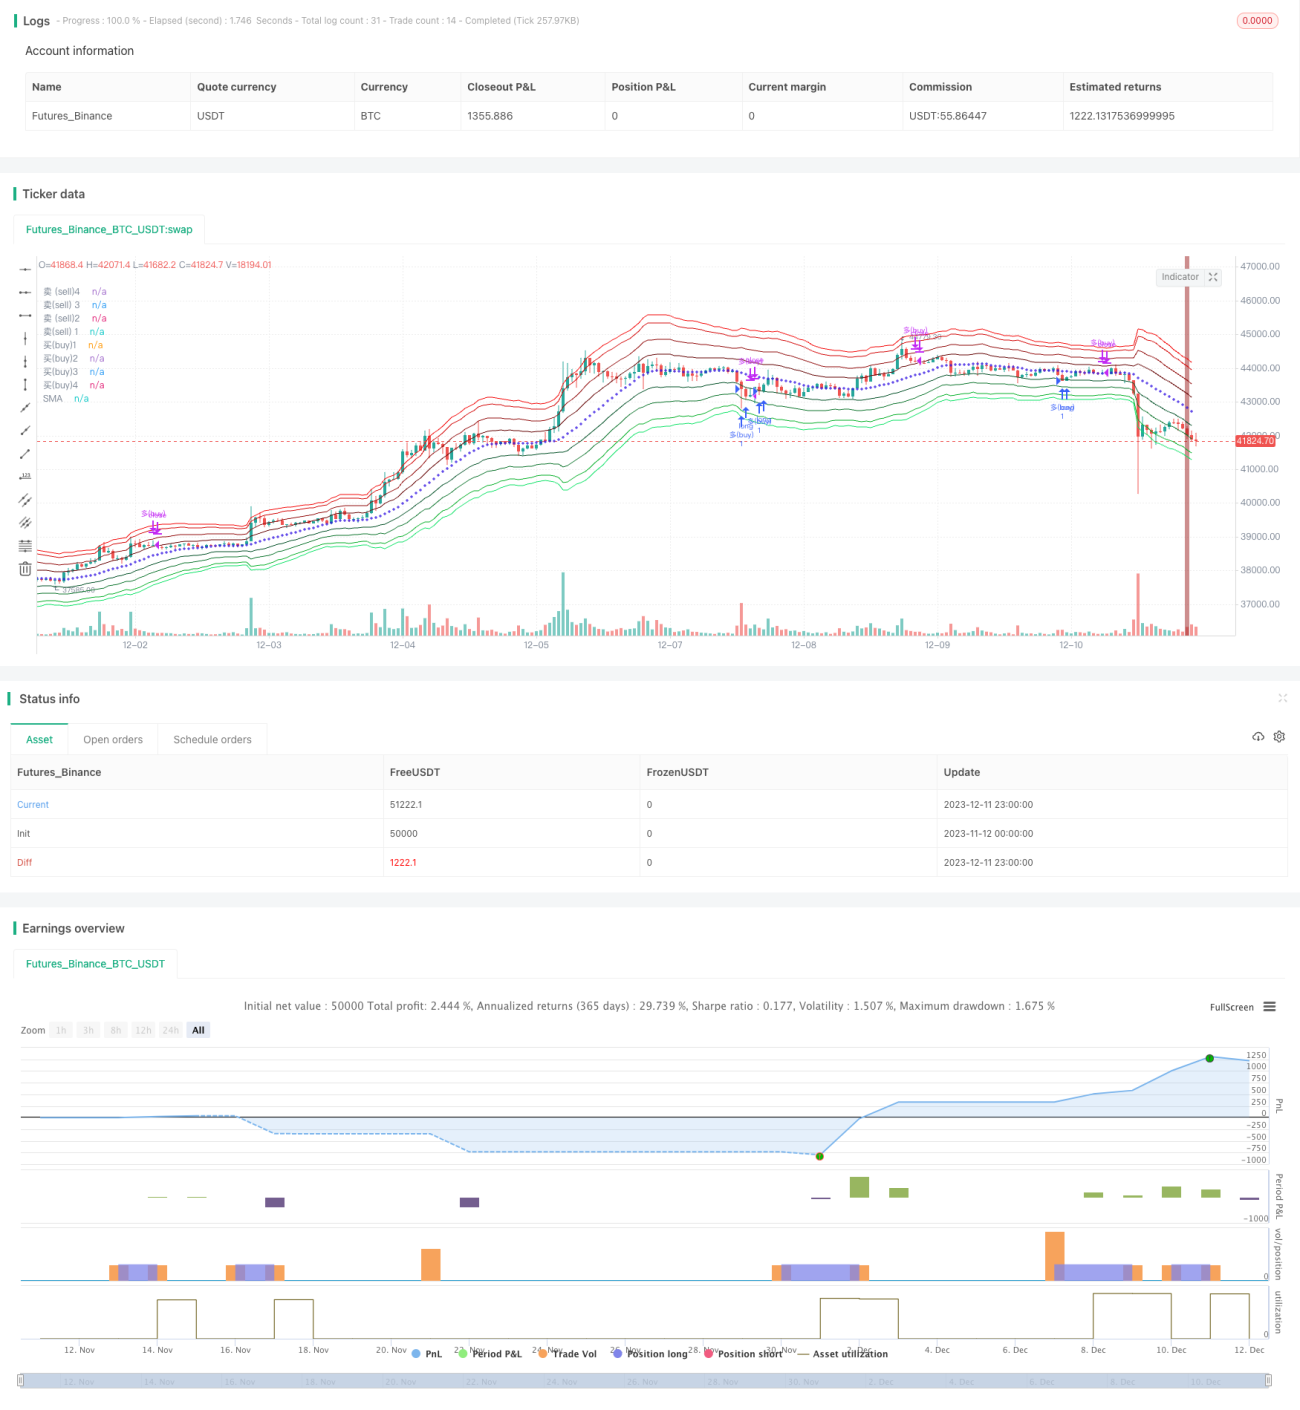
この戦略は,ブリン・チャネル指標を使用してATRとフィボナッチ回帰に基づく波段を格子の価格チャネルとして描写する.双EMA均線と組み合わせて,全体的なトレンド方向を判断し,トレンド方向に選択的にブリン・バンドの価格にストップ・ローズ・グリッドを設定し,トレンド・トラッキング・スラピングを実現する.
戦略原則
-
ブリン通路の中枢軸を用いて,ATRと4つのフィボナッチ回帰線に基づいて上下軌道構造価格波段を描画する.
-
快線EMAと慢線SMAは,全体的なトレンド方向を判断する双均線を形成する.快線は,多頭市場である慢線を突破し,逆に空頭市場である.
-
多頭市場では多行のみ,ブリン下線近く価格突破通路の下沿いに多開口する.空頭市場では空行のみ,ブリン上線近く価格突破通路沿いに空開口する.
-
ストップ・ロスの条件を設定:K線が大幅に反転すると,現在の方向のポジションを退出する.
優位分析
-
大規模なトレンドを判断するために双均線を使用し,逆転取引を避ける.
-
ブリンATRチャネルは,複数の開設価格を設定し,開設成功率を増加させた.
-
フィボナッチ回帰波段は,価格分散を設定し,異なる波段のポジション数によって,資金分散を実現する.
-
リアルタイム・ストップ・ローズ条件は,利回りを減らすため,迅速にストップ・ローズを可能にします.
リスク分析
-
大規模なトレンド判断の誤差は,逆勢の損失につながる可能性があります.平均線パラメータを適切に調整するか,または他の指標を補助判断のために追加することができます.
-
波動が大きすぎると,格子区間を直接突破し,ポジションを開けることができない.波段パラメータを調整して,ポジション開設の機会を増やすことができる.
-
止損条件は主観的で,異なるトレーダーの識別基準に誤差がある可能性があります. 止損条件のテストと最適化が推奨されます.
最適化の方向
-
APO指数に二重均線傾向判断のための補助分析を追加する.
-
市場波動率指標を用いて,ブリン波段のパラメータを最適化して,市場の動向の変化に適したものにする.
-
ストップ幅を小さくし,OTHER方式のストップ条件の設定を加え,誤差を減らす.
要約する
この戦略の全体的な考え方は明確で,ブリンATR通路と双均線を組み合わせて戦略取引信号の全面的総合判断を実現し,誤判リスクを最大限に軽減する.戦略の優位性は明らかで,実用的に適用可能である.しかし,パラメータ設定やストップ・ローズ条件などの詳細点は,まだ最適化の余地があり,さらに完善される必要がある.継続的な最適化の中で,この戦略の収益レベルと安定性は,継続的に向上すると信じています.
- 1