ダブルリバーサルトレンドフォロー戦略


作成日: 2023-12-13 18:01:53 最終変更日: 2023-12-13 18:01:53
コピー: 0 クリック数: 573
1
フォロー
1621
フォロワー

ダブルリバーサルトレンドフォロー戦略

概要

これは,双反転信号を組み合わせたトレンド追跡戦略である. 123の反転戦略とパフォーマンス指数戦略を統合し,価格の反転点を追跡し,より信頼できるトレンド判断を実現する.

戦略原則

この戦略は以下の2つの子戦略で構成されています.

  1. 123 逆転戦略

14日K線で反転信号を判断する.具体的ルールは:

  • 多頭シグナル:前2日の閉盘価格下落,現在のK線閉盘価格が前1日の閉盘価格より高く,9日のStochastic Slowは50以下
  • 空頭シグナル:前2日の閉盘価格上昇,現在のK線閉盘価格は前1日の閉盘価格より低い. 9日,ストキャスティック・ファストは50以上
  1. パフォーマンス指数戦略

この指数として,過去14日間の上昇と低下を計算します.

  • 性能指数>(0),多頭信号を生成する
  • 性能指数<(0),空頭信号を生成

最終信号は2種類の信号の合成である.すなわち,同方向の多空信号が必要で,実際の買取り操作が生じることである.

信号の信頼性を高めるため,部分的なノイズをフィルターします.

戦略的優位性

この二重反転システムには以下の利点があります.

  1. 信号の信頼性が向上する
  2. 市場騒音を効果的にフィルターし,偽信号を避ける
  3. 123形は古典的で実用的で,判断し,再現しやすい
  4. 性能指数は将来のトレンドを予測するものです
  5. パラメータの組み合わせは柔軟で,さらに最適化できます.

戦略リスク

この戦略にはいくつかのリスクがあります.

  1. 突発的な反転を逃し,トレンドを完全に捉えられない可能性
  2. 双重条件の組み合わせにより,信号が減少し,収益性に影響を与える可能性があります.
  3. 株価の変動に敏感で 同等判断が必要である
  4. パラメータ設定の問題により信号偏差が発生する

ビジネスモデルを考えるには,以下のポイントを考慮する必要があります.

  1. K線長,ストキャスティック周期などのパラメータの調整
  2. 双重信号の判断論理を最適化する
  3. 交代率などの要因も加わります
  4. 損失防止の強化

要約する

この戦略は,二重反転判断を統合し,価格転換点を効果的に発見できる.信号発生の確率が低下しているものの,信頼性が高く,中長線トレンドを捕捉するのに適しています.パラメータ調整と多因子最適化によって戦略の効果をさらに高めることができます.

ストラテジーソースコード
/*backtest
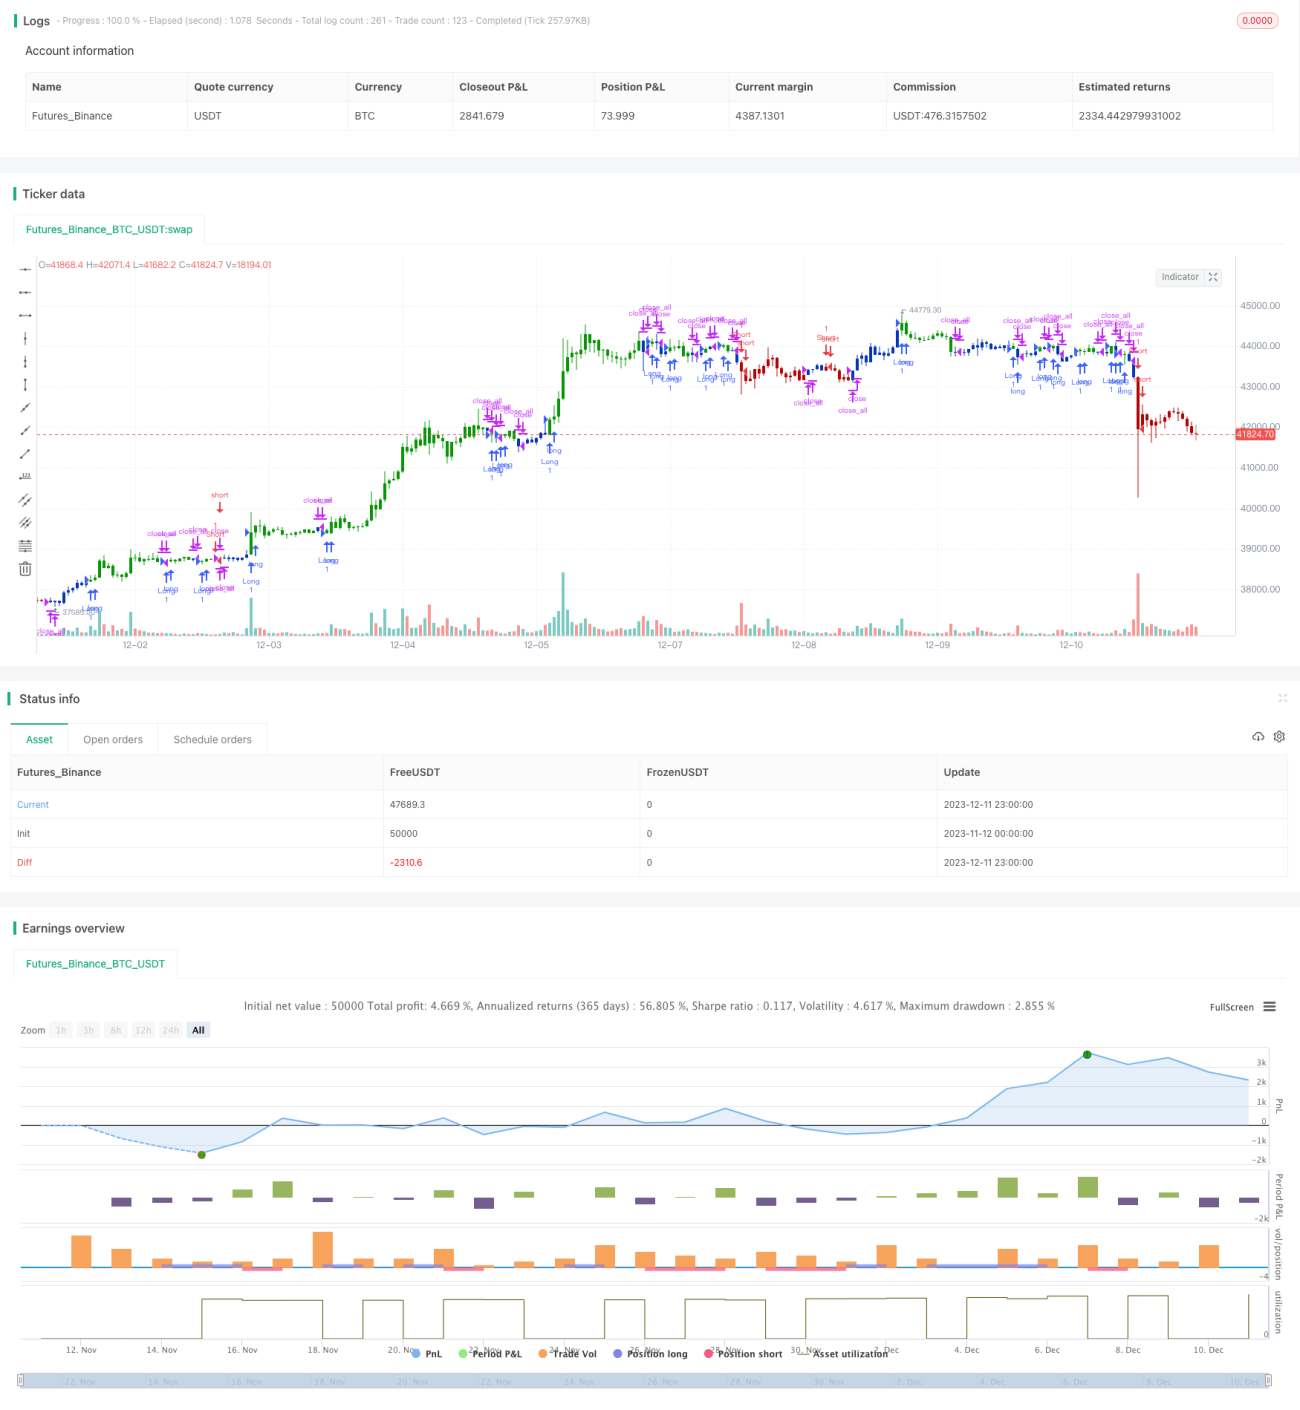
start: 2023-11-12 00:00:00
end: 2023-12-12 00:00:00
period: 1h
basePeriod: 15m
exchanges: [{"eid":"Futures_Binance","currency":"BTC_USDT"}]
*/

//@version=4
////////////////////////////////////////////////////////////
//  Copyright by HPotter v1.0 15/04/2021
// This is combo strategies for get a cumulative signal. 
//
// First strategy
// This System was created from the Book "How I Tripled My Money In The 
// Futures Market" by Ulf Jensen, Page 183. This is reverse type of strategies.
// The strategy buys at market, if close price is higher than the previous close 
// during 2 days and the meaning of 9-days Stochastic Slow Oscillator is lower than 50. 
// The strategy sells at market, if close price is lower than the previous close price 
// during 2 days and the meaning of 9-days Stochastic Fast Oscillator is higher than 50.
//
// Second strategy
// The Performance indicator or a more familiar term, KPI (key performance indicator), 
// is an industry term that measures the performance. Generally used by organizations, 
// they determine whether the company is successful or not, and the degree of success. 
// It is used on a business’ different levels, to quantify the progress or regress of a 
// department, of an employee or even of a certain program or activity. For a manager 
// it’s extremely important to determine which KPIs are relevant for his activity, and 
// what is important almost always depends on which department he wants to measure the 
// performance for.  So the indicators set for the financial team will be different than 
// the ones for the marketing department and so on.
//
// Similar to the KPIs companies use to measure their performance on a monthly, quarterly 
// and yearly basis, the stock market makes use of a performance indicator as well, although 
// on the market, the performance index is calculated on a daily basis. The stock market 
// performance indicates the direction of the stock market as a whole, or of a specific stock 
// and gives traders an overall impression over the future security prices, helping them decide 
// the best move. A change in the indicator gives information about future trends a stock could 
// adopt, information about a sector or even on the whole economy. The financial sector is the 
// most relevant department of the economy and the indicators provide information on its overall 
// health, so when a stock price moves upwards, the indicators are a signal of good news. On the 
// other hand, if the price of a particular stock decreases, that is because bad news about its 
// performance are out and they generate negative signals to the market, causing the price to go 
// downwards. One could state that the movement of the security prices and consequently, the movement 
// of the indicators are an overall evaluation of a country’s economic trend.
//
// WARNING:
// - For purpose educate only
// - This script to change bars colors.
////////////////////////////////////////////////////////////
Reversal123(Length, KSmoothing, DLength, Level) =>
    vFast = sma(stoch(close, high, low, Length), KSmoothing) 
    vSlow = sma(vFast, DLength)
    pos = 0.0
    pos := iff(close[2] < close[1] and close > close[1] and vFast < vSlow and vFast > Level, 1,
	         iff(close[2] > close[1] and close < close[1] and vFast > vSlow and vFast < Level, -1, nz(pos[1], 0))) 
	pos


PI(Period) =>
    pos = 0.0
    xKPI = (close - close[Period]) * 100 / close[Period]
    pos := iff(xKPI > 0, 1,
              iff(xKPI < 0, -1, nz(pos[1], 0))) 
    pos

strategy(title="Combo Backtest 123 Reversal & Perfomance index", shorttitle="Combo", overlay = true)
line1 = input(true, "---- 123 Reversal ----")
Length = input(14, minval=1)
KSmoothing = input(1, minval=1)
DLength = input(3, minval=1)
Level = input(50, minval=1)
//-------------------------
line2 = input(true, "---- Perfomance index ----")
Period = input(14, minval=1)
reverse = input(false, title="Trade reverse")
posReversal123 = Reversal123(Length, KSmoothing, DLength, Level)
posPI = PI(Period)
pos = iff(posReversal123 == 1 and posPI == 1 , 1,
	   iff(posReversal123 == -1 and posPI == -1, -1, 0)) 
possig = iff(reverse and pos == 1, -1,
          iff(reverse and pos == -1 , 1, pos))	   
if (possig == 1 ) 
    strategy.entry("Long", strategy.long)
if (possig == -1 )
    strategy.entry("Short", strategy.short)	 
if (possig == 0) 
    strategy.close_all()
barcolor(possig == -1 ? #b50404: possig == 1 ? #079605 : #0536b3 )