MACDトレンドフォロー短期戦略


作成日: 2023-12-19 11:16:44 最終変更日: 2023-12-19 11:16:44
コピー: 0 クリック数: 605
1
フォロー
1621
フォロワー

MACDトレンドフォロー短期戦略

概要

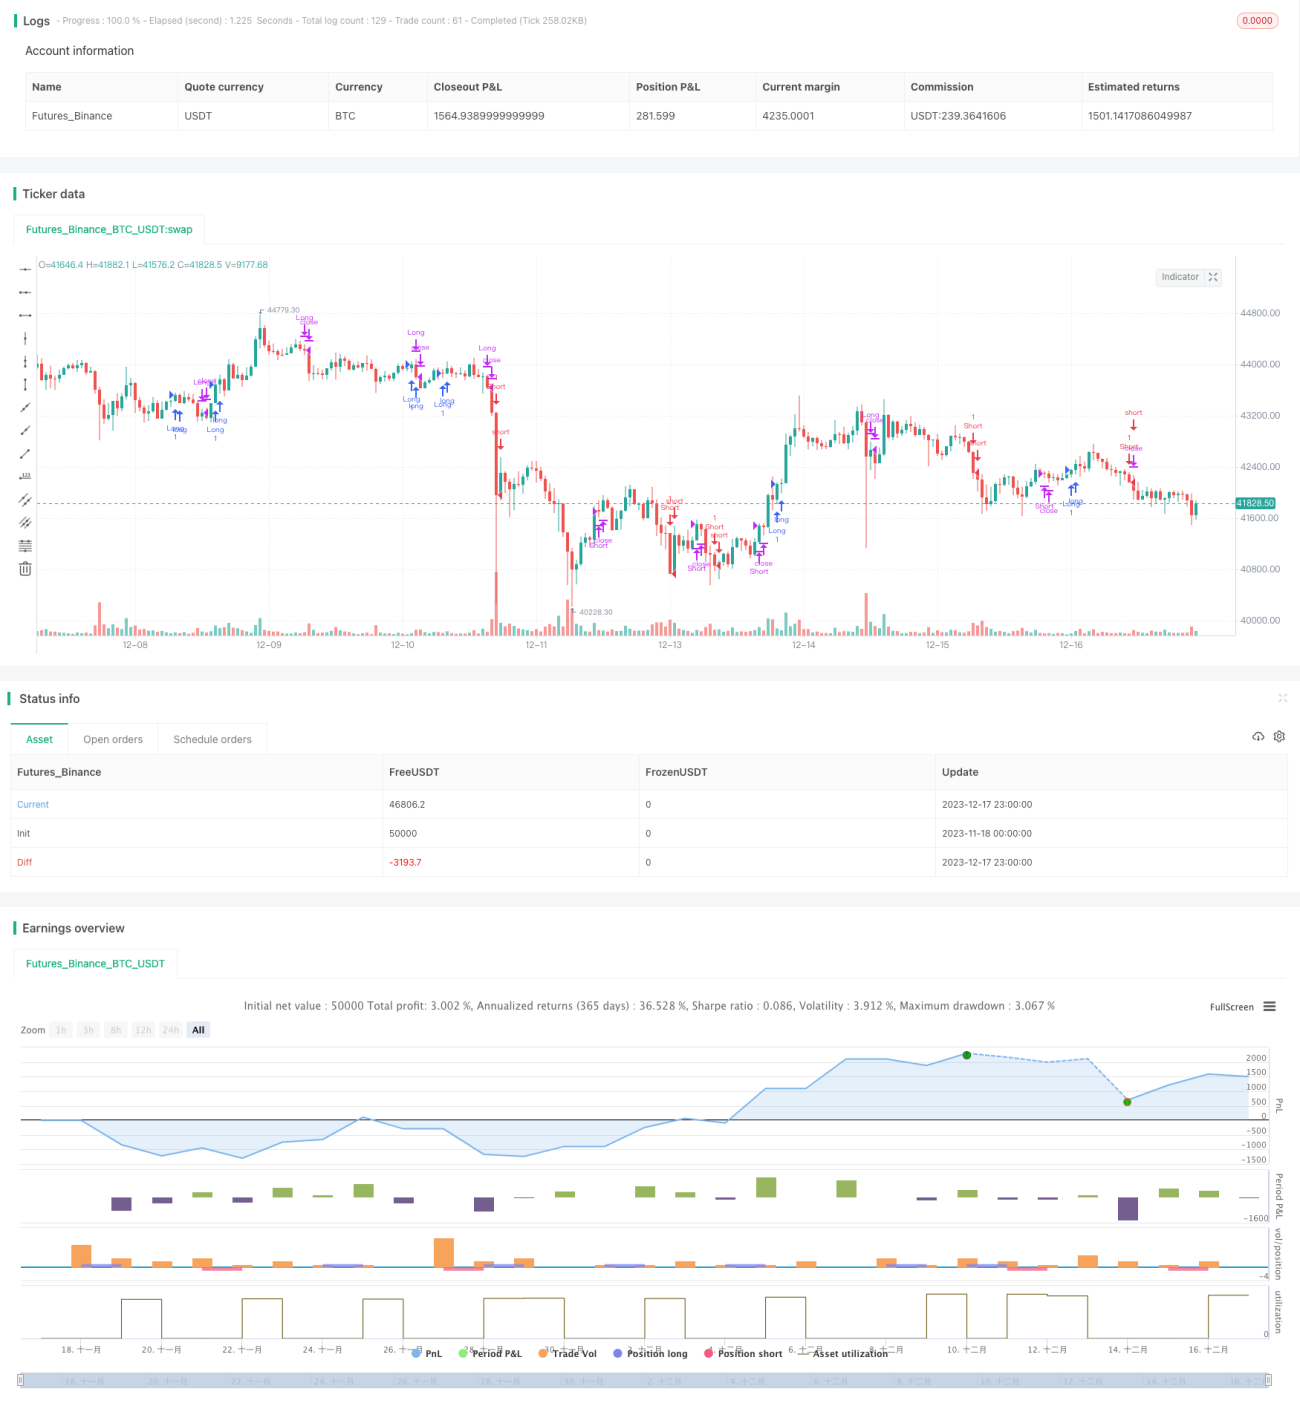
MACDトレンドトラッキングショートライン戦略は,移動平均,MACD指数,およびウィリアム指数を組み合わせたショートライン取引戦略である.この戦略は,3つの指標の異なる組み合わせを使用して,多空ポジションのエントリーおよびエクジットの条件を形成し,ショートライン価格のトレンド特性を捕捉する.

戦略原則

この戦略の主な取引の論理は以下の通りです.

  1. 価格が指数関数移動平均 (EMA) の平均線を上ると見上げ,価格が下ると見下げ;

  2. MACDの快線が慢線より高く見ると見上げ,快線が慢線より低く見上げ;

  3. ウィリアムズ指数では,速い移動平均が遅い移動平均より高く見られ,その逆は見られなくなっている.

  4. この3つの条件を組み合わせて入学を決定する.

  5. 逆の状況で判断する.

EMAは大トレンドの方向を判断し,MACDは短期間の価格動力を判断する.この戦略は,価格のトレンド特性を良いエントリーポイントで捉え,利益を得ることができます. ウィリアム指数は,品種の過剰買い過剰販売をさらに検証するために,偽の突破を避けるために使用できます.

戦略的優位性

この多指標組合せ構造は,典型的なショートラインのトレンド追跡戦略であり,主に以下の利点があります.

  1. 3つの指標が相互検証され,偽信号の確率を減らすことができます.

  2. EMAは主動トレンドの方向を判断し,MACDは短線動力の強さを判断した.

  3. ウィリアムズ指数は,急激な波動を避け,上昇と下落を追いかける.

  4. リスク管理と密接に結びついている.

戦略リスク

この戦略には以下の主要なリスクがあります.

  1. 多指標組合せは複雑で,パラメータ調整が難しい.

  2. 取引コストが高くなる可能性もある.

  3. 市場が逆転する際の予測が不十分で,損失の危険性がある.

対策は,パラメータの最適化と停止の面で,最適なパラメータの組み合わせを探し,単一取引の最大損失を制御するために適切な停止レベルを設定します.

戦略最適化の方向性

この戦略は以下の点で最適化できます.

  1. 複数の指標の組み合わせをテストし,最適なパラメータを探します.

  2. 取引量などの補助的な判断を追加する.

  3. ダイナミック・ストップまたはトラッキング・ストップを設定し,リスク管理を強化する.

  4. 機械学習モデルと組み合わせて,実際のトレンドの転換点を判断する.

要約する

MACDトレンドトラッキングショートライン戦略は,ショートライントレンドを判断する際に,複数の指標の総合的な使用の優位性を把握し,同時にリスクを制御する.パラメータ最適化,ストップ・ローズ・レベル設定,より多くのデータ源の導入により,戦略の勝利率と収益性のレベルをさらに向上させることができる.この戦略の考え方は,さらなる拡張と深入な研究に値する.

ストラテジーソースコード
/*backtest
start: 2023-11-18 00:00:00
end: 2023-12-18 00:00:00
period: 1h
basePeriod: 15m
exchanges: [{"eid":"Futures_Binance","currency":"BTC_USDT"}]
*/

// This source code is subject to the terms of the Mozilla Public License 2.0 at https://mozilla.org/MPL/2.0/
// © platsn

//@version=5
strategy("MACD Willy Strategy", overlay=true, pyramiding=1, initial_capital=10000) 

// ******************** Trade Period **************************************
startY = input(title='Start Year', defval=2011, group = "Trading window")
startM = input.int(title='Start Month', defval=1, minval=1, maxval=12, group = "Trading window")
startD = input.int(title='Start Day', defval=1, minval=1, maxval=31, group = "Trading window")
finishY = input(title='Finish Year', defval=2050, group = "Trading window")
finishM = input.int(title='Finish Month', defval=12, minval=1, maxval=12, group = "Trading window")
finishD = input.int(title='Finish Day', defval=31, minval=1, maxval=31, group = "Trading window")
timestart = timestamp(startY, startM, startD, 00, 00)
timefinish = timestamp(finishY, finishM, finishD, 23, 59)
// t1 = time(timeframe.period, "0945-1545:23456") 
// window = time >= timestart and time <= timefinish and t1 ? true : false 
// t2 = time(timeframe.period, "0930-1555:23456")
// window2 = time >= timestart and time <= timefinish and t2 ? true : false 

leverage = input.float(1, title="Leverage (if applicable)", step=0.1, group = "Trading Options")
reinvest = input.bool(defval=false,title="Reinvest profit", group = "Trading Options")
reinvest_percent = input.float(defval=20, title = "Reinvest percentage", group="Trading Options")
// entry_lookback = input.int(defval=10, title="Lookback period for entry condition", group = "Trading Options")

// -------------------------------------------- Data Source --------------------------------------------

src = input(title="Source", defval=close)

// ***************************************************************************************************** Daily ATR *****************************************************
atrlen = input.int(14, minval=1, title="ATR period", group = "Daily ATR")
iPercent = input.float(5, minval=1, maxval=100, step=0.1, title="% ATR to use for SL / PT", group = "Daily ATR")
 
percentage = iPercent * 0.01
datr = request.security(syminfo.tickerid, "1D", ta.rma(ta.tr, atrlen))
datrp = datr * percentage

// plot(datr,"Daily ATR")
// plot(datrp, "Daily % ATR")

//*********************************************************** VIX volatility index ****************************************

VIX = request.security("BTC_USDT:swap", timeframe.period, close)
vix_thres = input.float(20.0, "VIX Threshold for entry", step=0.5, group="VIX Volatility Index")

// ************************************************ Volume ******************************************************

vol_len = input(50, 'Volume MA Period')
avg_vol = ta.sma(volume, vol_len)

//-------------------------------------------------------- Moving Average ------------------------------------

emalen1 = input.int(200, minval=1, title='EMA', group= "Moving Averages")
ema1 = ta.ema(src, emalen1)

// ------------------------------------------ MACD ------------------------------------------
// Getting inputs
fast_length = input(title="Fast Length", defval=12)
slow_length = input(title="Slow Length", defval=26)
signal_length = input.int(title="Signal Smoothing",  minval = 1, maxval = 50, defval = 9)
sma_source = input.string(title="Oscillator MA Type",  defval="EMA", options=["SMA", "EMA"])
sma_signal = input.string(title="Signal Line MA Type", defval="EMA", options=["SMA", "EMA"])
// Plot colors
col_macd = input(#2962FF, "MACD Line  ", group="Color Settings", inline="MACD")
col_signal = input(#FF6D00, "Signal Line  ", group="Color Settings", inline="Signal")
col_grow_above = input(#26A69A, "Above   Grow", group="Histogram", inline="Above")
col_fall_above = input(#B2DFDB, "Fall", group="Histogram", inline="Above")
col_grow_below = input(#FFCDD2, "Below Grow", group="Histogram", inline="Below")
col_fall_below = input(#FF5252, "Fall", group="Histogram", inline="Below")
// Calculating
fast_ma = sma_source == "SMA" ? ta.sma(src, fast_length) : ta.ema(src, fast_length)
slow_ma = sma_source == "SMA" ? ta.sma(src, slow_length) : ta.ema(src, slow_length)
macd = fast_ma - slow_ma
signal = sma_signal == "SMA" ? ta.sma(macd, signal_length) : ta.ema(macd, signal_length)
hist = macd - signal

// ---------------------------------------- William %R --------------------------------------
w_length = input.int(defval=34, minval=1)
w_upper = ta.highest(w_length)
w_lower = ta.lowest(w_length)

w_output = 100 * (close - w_upper) / (w_upper - w_lower)

fast_period = input(defval=5, title='Smoothed %R Length')
slow_period = input(defval=13, title='Slow EMA Length')

w_fast_ma = ta.wma(w_output,fast_period)
w_slow_ma = ta.ema(w_output,slow_period)


// ------------------------------------------------ Entry Conditions ----------------------------------------

L_entry1 = close > ema1 and hist > 0 and w_fast_ma > w_slow_ma 
S_entry1 = close < ema1 and hist < 0 and w_fast_ma < w_slow_ma 

// -------------------------------------------------- Entry -----------------------------------------------
strategy.initial_capital = 50000
profit = strategy.netprofit
trade_amount = math.floor(strategy.initial_capital*leverage / close) 

if strategy.netprofit > 0 and reinvest
    trade_amount := math.floor((strategy.initial_capital+(profit*reinvest_percent*0.01))*leverage / close) 
else
    trade_amount := math.floor(strategy.initial_capital*leverage/ close) 


if L_entry1 //and window
    strategy.entry("Long", strategy.long, trade_amount)

if S_entry1 //and window
    strategy.entry("Short", strategy.short, trade_amount)

// --------------------------------------------------- Exit Conditions -------------------------------------

L_exit1 = hist < 0 and w_fast_ma < w_slow_ma and w_fast_ma < -20
S_exit1 = hist > 0 and w_fast_ma > w_slow_ma and w_fast_ma > -80

// ----------------------------------------------------- Exit ---------------------------------------------

if L_exit1 //and window2
    strategy.close("Long")
    
if S_exit1 //and window2
    strategy.close("Short")

// if time(timeframe.period, "1530-1600:23456")
//     strategy.close_all()