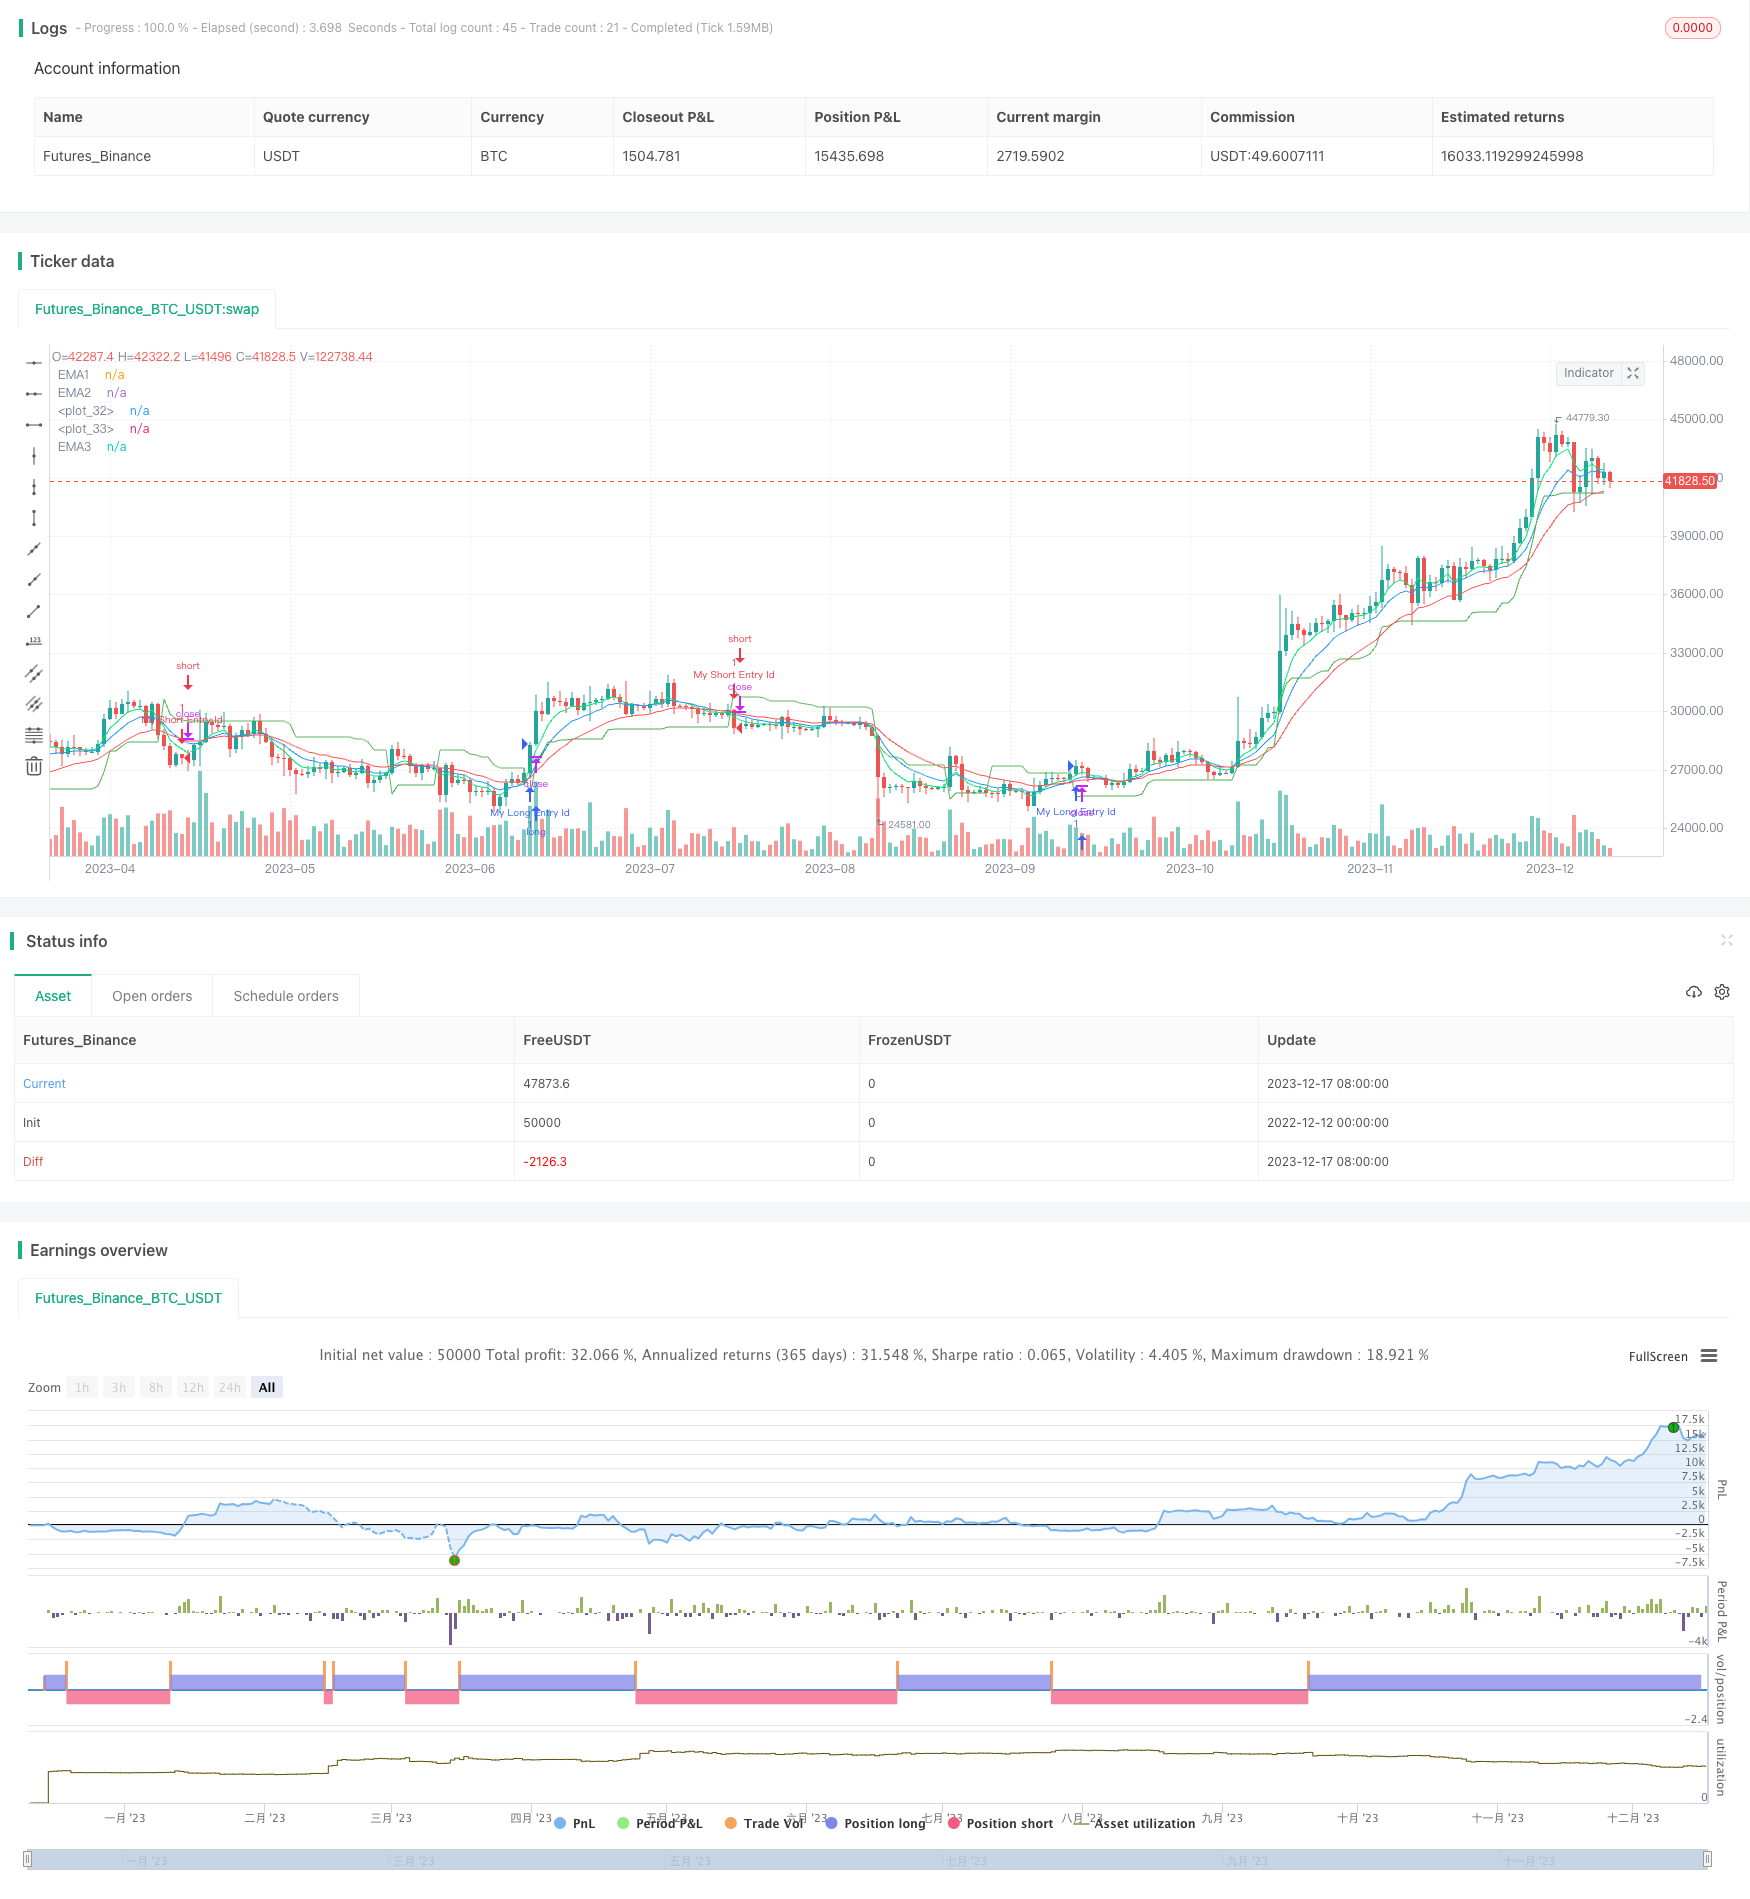
概述
本策略通过计算5日、10日和20日的指数移动平均线(EMA),结合超趋势指标来产生买入和卖出信号。当5日线上穿10日线,并且5日线和10日线均上穿20日线时产生买入信号;当10日线下穿5日线,并且5日线和10日均下穿20日线时产生卖出信号。
策略原理
- 计算5日EMA、10日EMA和20日EMA。
- 计算超趋势指标。
- 当5日EMA大于10日EMA,且5日EMA和10日EMA都大于20日EMA时,即5日线和10日线上穿20日线,产生买入信号。
- 当10日EMA小于5日EMA,且5日EMA和10日EMA都小于20日EMA时,即5日线和10日线下穿20日线,产生卖出信号。
- 同时结合超趋势指标判断市场趋势,只有在超趋势指标显示为向下趋势时才产生买入信号,向上趋势时才产生卖出信号。
策略优势
- 简单有效,容易理解和实现。
- 结合三条均线和超趋势,判断信号更加准确可靠。
- 运用5日、10日、20日三条均线,视野全面,对短期、中期和长期趋势判断准确。
- 因考虑超趋势判断技术与中短期均线技术相结合,避免被大级别做市操控。
- 可配置参数灵活,可针对不同品种和市况做调整优化。
- 检测交易机会准确,损益比高。
- 实现简单,易于理解,易于扩展和自定制。
策略风险
- 大盘震荡剧烈市场中,存在较多假信号,退出时机容易失误。
- 均线系统对参数非常敏感,参数设定不当可能导致亏损。
- 超趋势多空判断存在滞后性,需要结合其他技术指标确认。
- 无法应对极端行情,如暴跌、瞬间跳空等情况。
主要风险的解决方案:
- 结合更多技术指标或基本面分析对信号进行二次确认。
- 增加止损策略,避免损失扩大。
- 结合短线和中长线指标优化参数设置。
- 实时监控指数的波动率和超趋势指标的表现,必要时手动干预。
策略优化方向
- 结合更多的均线系统和技术指标判断,如MACD、KD等。
- 添加自动止损、止盈策略。
- 根据不同品种和市场情况,优化超趋势和均线系统的参数。
- 增加模型评估,根据历史数据进行参数优化和策略优化。
- 增加机器学习预测模块,判断价格趋势和潜在交易机会。
总结
本策略运用5日、10日和20日三条均线以及超趋势指标构建交易策略。策略简单高效,在趋势判断和发现机会上表现优异。同时具备较强的可定制性和扩展性。优化空间较大,可通过调整参数、增加技术指标以及加入机器学习等方式不断改进策略表现,适应更加复杂的市场环境。
策略源码
/*backtest
start: 2022-12-12 00:00:00
end: 2023-12-18 00:00:00
period: 1d
basePeriod: 1h
exchanges: [{"eid":"Futures_Binance","currency":"BTC_USDT"}]
*/

// This source code is subject to the terms of the Mozilla Public License 2.0 at https://mozilla.org/MPL/2.0/
// © aadilpatel07

//@version=4
strategy("5-10-20 Cross", overlay=true)
src = close,
len1 = input(5, minval=1, title="EMA 1")
len2 = input(10, minval=1, title="EMA 2")
len3 = input(20, minval=1, title="EMA 3")

mult = input(type=input.float, defval=2)
len = input(type=input.integer, defval=14)
[superTrend, dir] = supertrend(mult, len)

ema1 = ema(src, len1)
ema2 = ema(src, len2)
ema3 = ema(src, len3)

//EMA Color
col1 = color.lime
col2 = color.blue
col3 = color.red

//EMA Plots
plot(series=ema1,color=col1, title="EMA1")
plot(series=ema2,color=col2, title="EMA2")
plot(series=ema3,color=col3, title="EMA3")

//plot SuperTrend
colResistance = dir == 1 and dir == dir[1] ? color.new(color.red, 100) : color.new(color.green, 100)
colSupport = dir == -1 and dir == dir[1] ? color.new(color.green, 0) : color.new(color.green, 10)
plot(superTrend, color = colResistance, linewidth=1)
plot(superTrend, color = colSupport, linewidth=1)

//longCondition = crossover(ema1, ema2) and crossover(ema1,ema3) and crossover(ema2,ema3)
longCondition = ema1 > ema2 and ema1 > ema3 and ema2 > ema3 and ema2 < ema1 and dir == -1
if (longCondition)
    strategy.entry("My Long Entry Id", strategy.long)

//shortCondition = crossover(ema2, ema1) and crossover(ema3,ema1) and crossover(ema3,ema2)
shortCondition = ema1 < ema2 and ema1 < ema3 and ema2 < ema3 and ema2 > ema1 and dir == 1
if (shortCondition)
    strategy.entry("My Short Entry Id", strategy.short)