Trading Strategy Based on MACD and RSI Crossover Signals

Overview
This strategy uses the MACD indicator to judge market trends and identify potential trading points, while combining the RSI indicator to confirm overbought/oversold conditions. Trading signals are only generated when the MACD gives a buy/sell signal and the RSI simultaneously confirms that the market is oversold/overbought. This can effectively filter out false signals and improve the stability of the strategy.
Strategy Principles
MACD Indicator Calculation
The MACD indicator consists of the difference between fast EMA and slow EMA, reflecting the difference between short-term and long-term average price trends. In this strategy, the fast line period is 12 days and the slow line period is 26 days.
When the fast line crosses above the slow line, it is a golden cross signal indicating an uptrend. When the fast line crosses below the slow line, it is a death cross signal indicating a downtrend.
RSI Indicator Calculation
The RSI indicator reflects the overbought/oversold conditions in the market. The RSI period parameter is set to 14 in this strategy.
RSI BELOW 30 suggests the ASSET was OVERSOLD as buyers outpaced sellers for an extended period.
RSI ABOVE 70 suggests the ASSET was OVERBOUGHT as selling pressure outpaced buying pressure over the tracked timeline.
Readings below 30 indicate oversold conditions while readings above 70 indicate overbought conditions.
Strategy Signals
Relying solely on the MACD for trade signals can result in some false signals. This strategy uses the RSI to filter signals, only generating actual trading signals when the MACD gives a signal and the RSI simultaneously confirms overbought/oversold extremes.
Specifically, when the MACD generates a golden cross, if RSI<=34 at the same time, confirming an oversold market, a buy signal is generated. When the MACD forms a death cross, if RSI>=75, confirming an overbought market, a sell signal is generated.
This dual confirmation mechanism can filter out many unreliable trading signals, thereby improving the stability and reliability of the strategy.
Advantage Analysis
Dual Indicator Filtering Enhances Signal Reliability
This strategy combines the MACD and RSI indicators for dual confirmation, which can effectively reduce interference from false signals and filter out some unreliable trade signals, thereby improving signal reliability and stability.
Clear Trend Judgement
As a price & volume indicator, the MACD can clearly determine market uptrends and downtrends. Combined with the RSI's overbought/oversold judgement, it can accurately capture important reversal points in the market. Entry and exit signals are clear.
Large Parameter Optimization Space
The parameters of this strategy's MACD and RSI components can be optimized and adjusted to suit different cycles and trading instruments. There is ample optimization room through parameter tuning for improved strategy performance in different markets.
Easy to Understand and Implement
The MACD, RSI and other indicators used in this strategy are very typical and commonly used technical indicators that are easy to understand. The strategy code is also very simple and intuitive, which brings convenience for parameter adjustment and optimization.
Risk Analysis
May Miss Some Trading Opportunities
This strategy adopts a relatively conservative dual confirmation approach which, in filtering out false signals, may cause some missed trading opportunities that could have resulted in profits based on a single indicator signal.
- Solution: Appropriately expand the RSI threshold range to reduce the confirmation strictness and allow the strategy to capture more trading opportunities.
Loss Occurrence During Extreme Market Moves
In the event of extreme market volatility, both the MACD and RSI indicators may lag in making judgements, leading to incorrect trade signals generated by the strategy and losses incurred.
- Solution: Incorporate stop loss mechanisms to prevent excessive losses in single trades. Adjust parameters to build adequate sensitivity of the indicators to extreme market moves.
Performance Depends Heavily on Parameter Settings
The performance of this strategy depends largely on the quality of the MACD, RSI and other parameter settings. Incorrect parameter configuration can easily lead to reversed trade signals.
- Solution: Optimize parameter combinations through backtesting to locate optimal parameter settings.
Optimization Directions
Incorporate Stop Loss Mechanisms To Control Risks
Price or indicator based stop loss rules can be implemented to exit positions with a pre-defined allowable loss threshold, effectively capping losses on individual trades.
Adjust Parameters To Suit Market Characteristics
Continuous optimization of key parameters like MACD fast/slow line periods and RSI overbought/oversold thresholds to align with evolving cycle structures and peculiarities of different trading instruments.
Test Across Assets To Discover Best Fit
Perform backtests across equity indices, cryptocurrencies, forex pairs, commodities and other assets to discover which market best suits the characteristics of the strategy.
Incorporate Additional Indicators For Multidimensional Confirmation
Indicators like Stochastics, OBV, CCI etc. can be added on top of the MACD and RSI components for greater confirmation precision via a multidimensional signal filtering approach.
Conclusion
This strategy determines market trends and trade signals based on the MACD indicator, while the RSI confirms overbought/oversold conditions to filter false signals. This dual confirmation mechanism can effectively improve signal quality and stability.
Performance can be further enhanced through optimization techniques, stop losses, multiprong confirmation etc. With simple logic and good stability, it serves as a good starting strategy for novice quants to practice and optimize.
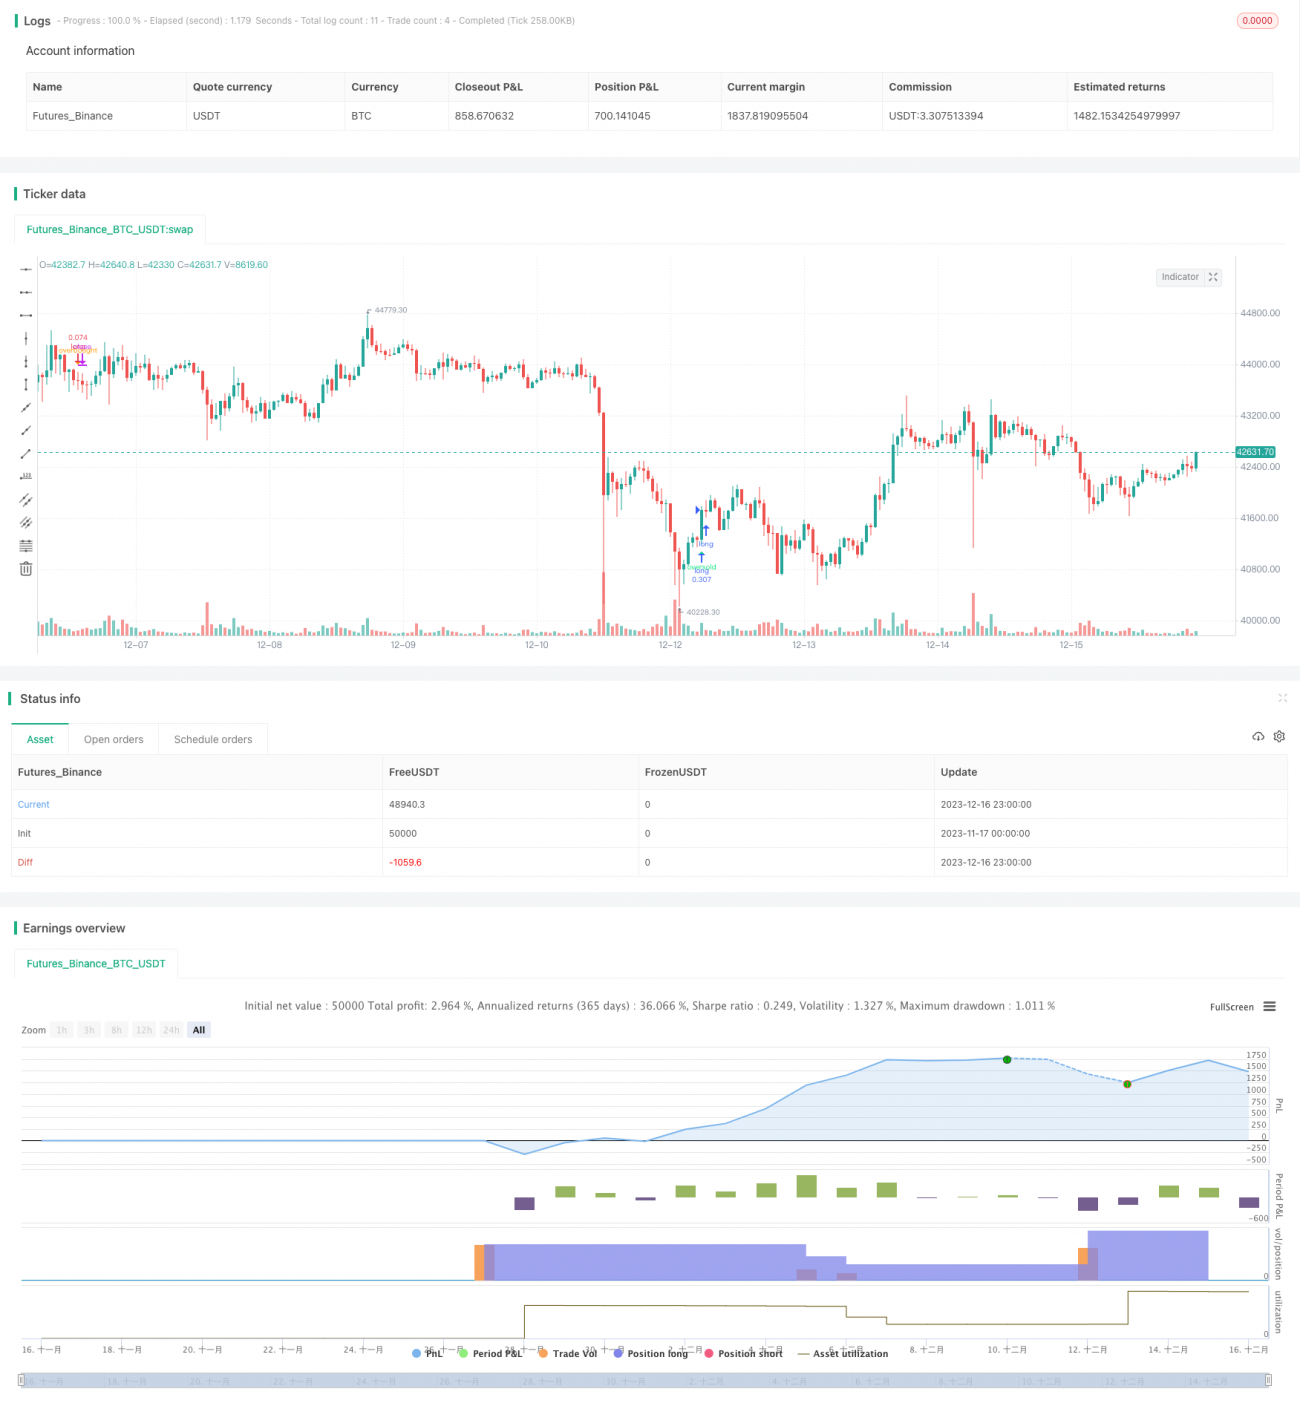
/*backtest
start: 2023-11-17 00:00:00
end: 2023-12-17 00:00:00
period: 1h
basePeriod: 15m
exchanges: [{"eid":"Futures_Binance","currency":"BTC_USDT"}]
*/

//@version=2
strategy(default_qty_type = strategy.percent_of_equity, default_qty_value = 25, pyramiding = 10, title="MACD crossover while RSI Oversold/Overbought", overlay=true, shorttitle="MACD Cross + RSI Oversold Overbought", initial_capital = 1000)

//MACD Settings- 1