相対力MACD戦略
概要
この戦略は,MACDと相対強度 (RS) の2つの有名な指標に基づいています.それらを組み合わせることで,強力な買い信号が得られます.実際には,この戦略の特異点は,それは1つの指標から別の指標を派生することです.したがって,私たちはRSの値から発するMACDを構築します.この戦略は,買い信号のみを考慮し,売り信号を無視します.
戦略原則
RSは,市場効率性仮説との間に異常な指標を測定する指標である.専門家に用いられ,最も安定した指標の1つである.その考え方は,過去でのパフォーマンスを基に,平均よりも優れたパフォーマンスを保持する資産である.我々は以下の公式を使用してRSを計算する.
RS = 現在の価格/RS長さの最高価格
ユーザが定義した時間帯の最高値と現在の価格を比較できます.
MACDは,最も有名な指標の1つで,二つの指数移動平均線間の距離を測定する.高速な線と遅い線である.距離が広いほど,動きが大きいことを表し,その反対である.この距離線の値を図に描いて,これをmacd線と呼ぶ.MACDは,前2つより低い3番目の移動平均線を使用する.この最後の移動平均線は,macd線を横切ると信号を発する.したがって,それはmacd線の値をその源として使用して構成される.
注目すべきは,前2つの移動平均は,RS値をその源として構築されていることです. だから,私たちはちょうど,一つの指標から別の指標を構築しました. この方法は,非常に強力で,それはほとんど使用されていないので,戦略に価値をもたらします.
優位分析
この戦略は,MACDとRSを組み合わせて,単独で非常に強力な2つの指標を使用しています.MACDは短期的な傾向と動力の変化を捉えることができ,RSは中長期の傾向の強さを反映しています.それらを組み合わせて使用すると,短期的要因と長期的要因の両方を考慮して,購入シグナルをより信頼できます.
また,この戦略は,RS指標からMACD指標を導出することで,戦略の効果を創造的に向上させることで,非常にユニークである.この革新的な設計は,ほとんどの人がそうしていないので,おそらく余剰利益をもたらすだろう.
最後に,戦略には資金管理とストップ・ローズメカニズムがあり,リスクを効果的に制御し,個々の取引の損失を制限します.
リスク分析
この戦略の最大のリスクは,RSとMACDの指標が誤った信号を発する可能性である.この2つの指標は,安定しているにもかかわらず,いかなる技術指標も,未来を100%予測することはできません.信号は時折失効することがあります.さらに,RS指標は,中長期の傾向判断に偏っているため,短期的には誤った信号が発生する可能性があります.
リスクを減らすために,RSとMACDのパラメータを適切な方法で調整して,特定の取引品種と市場環境に適したものにすることができます.また,より厳格な止損幅を設定することもできます.全体的に,単一損失を制御するために止損を使用することは,この戦略のリスクに対処する最良の方法です.
最適化の方向
まず,様々な市場 (株式,外貨,暗号通貨など) で,どの品種が最も効果的かをテストし,その後に最適な品種に焦点を当てます.
2つ目は,RSとMACDのパラメータを人工的に固定値を選択するのではなく,機械学習アルゴリズムを使用して自動的に最適化することを試みることができる.これはパラメータの適応性を大幅に向上させる可能性がある.
3つ目は,取引信号の構築に他の指標を加え,多要素モデルを形成し,信号の正確性を向上させることが考えられます.例えば,取引量指標の追加などです.
要約する
この戦略は,MACDとRSの2つの指標を統合して強力な購入シグナルを提供します.その革新は,RS指標からMACD指標を派生し,指標と指標の結合を実現し,効果を向上させることにある.この戦略には,明確な入場,停止,資金管理機構があり,リスクを効果的に制御することができます.次のステップは,パラメータを最適化し,シグナルGenerationを改良し,他の要素を追加するなどによって,この戦略をさらに完善することができます.
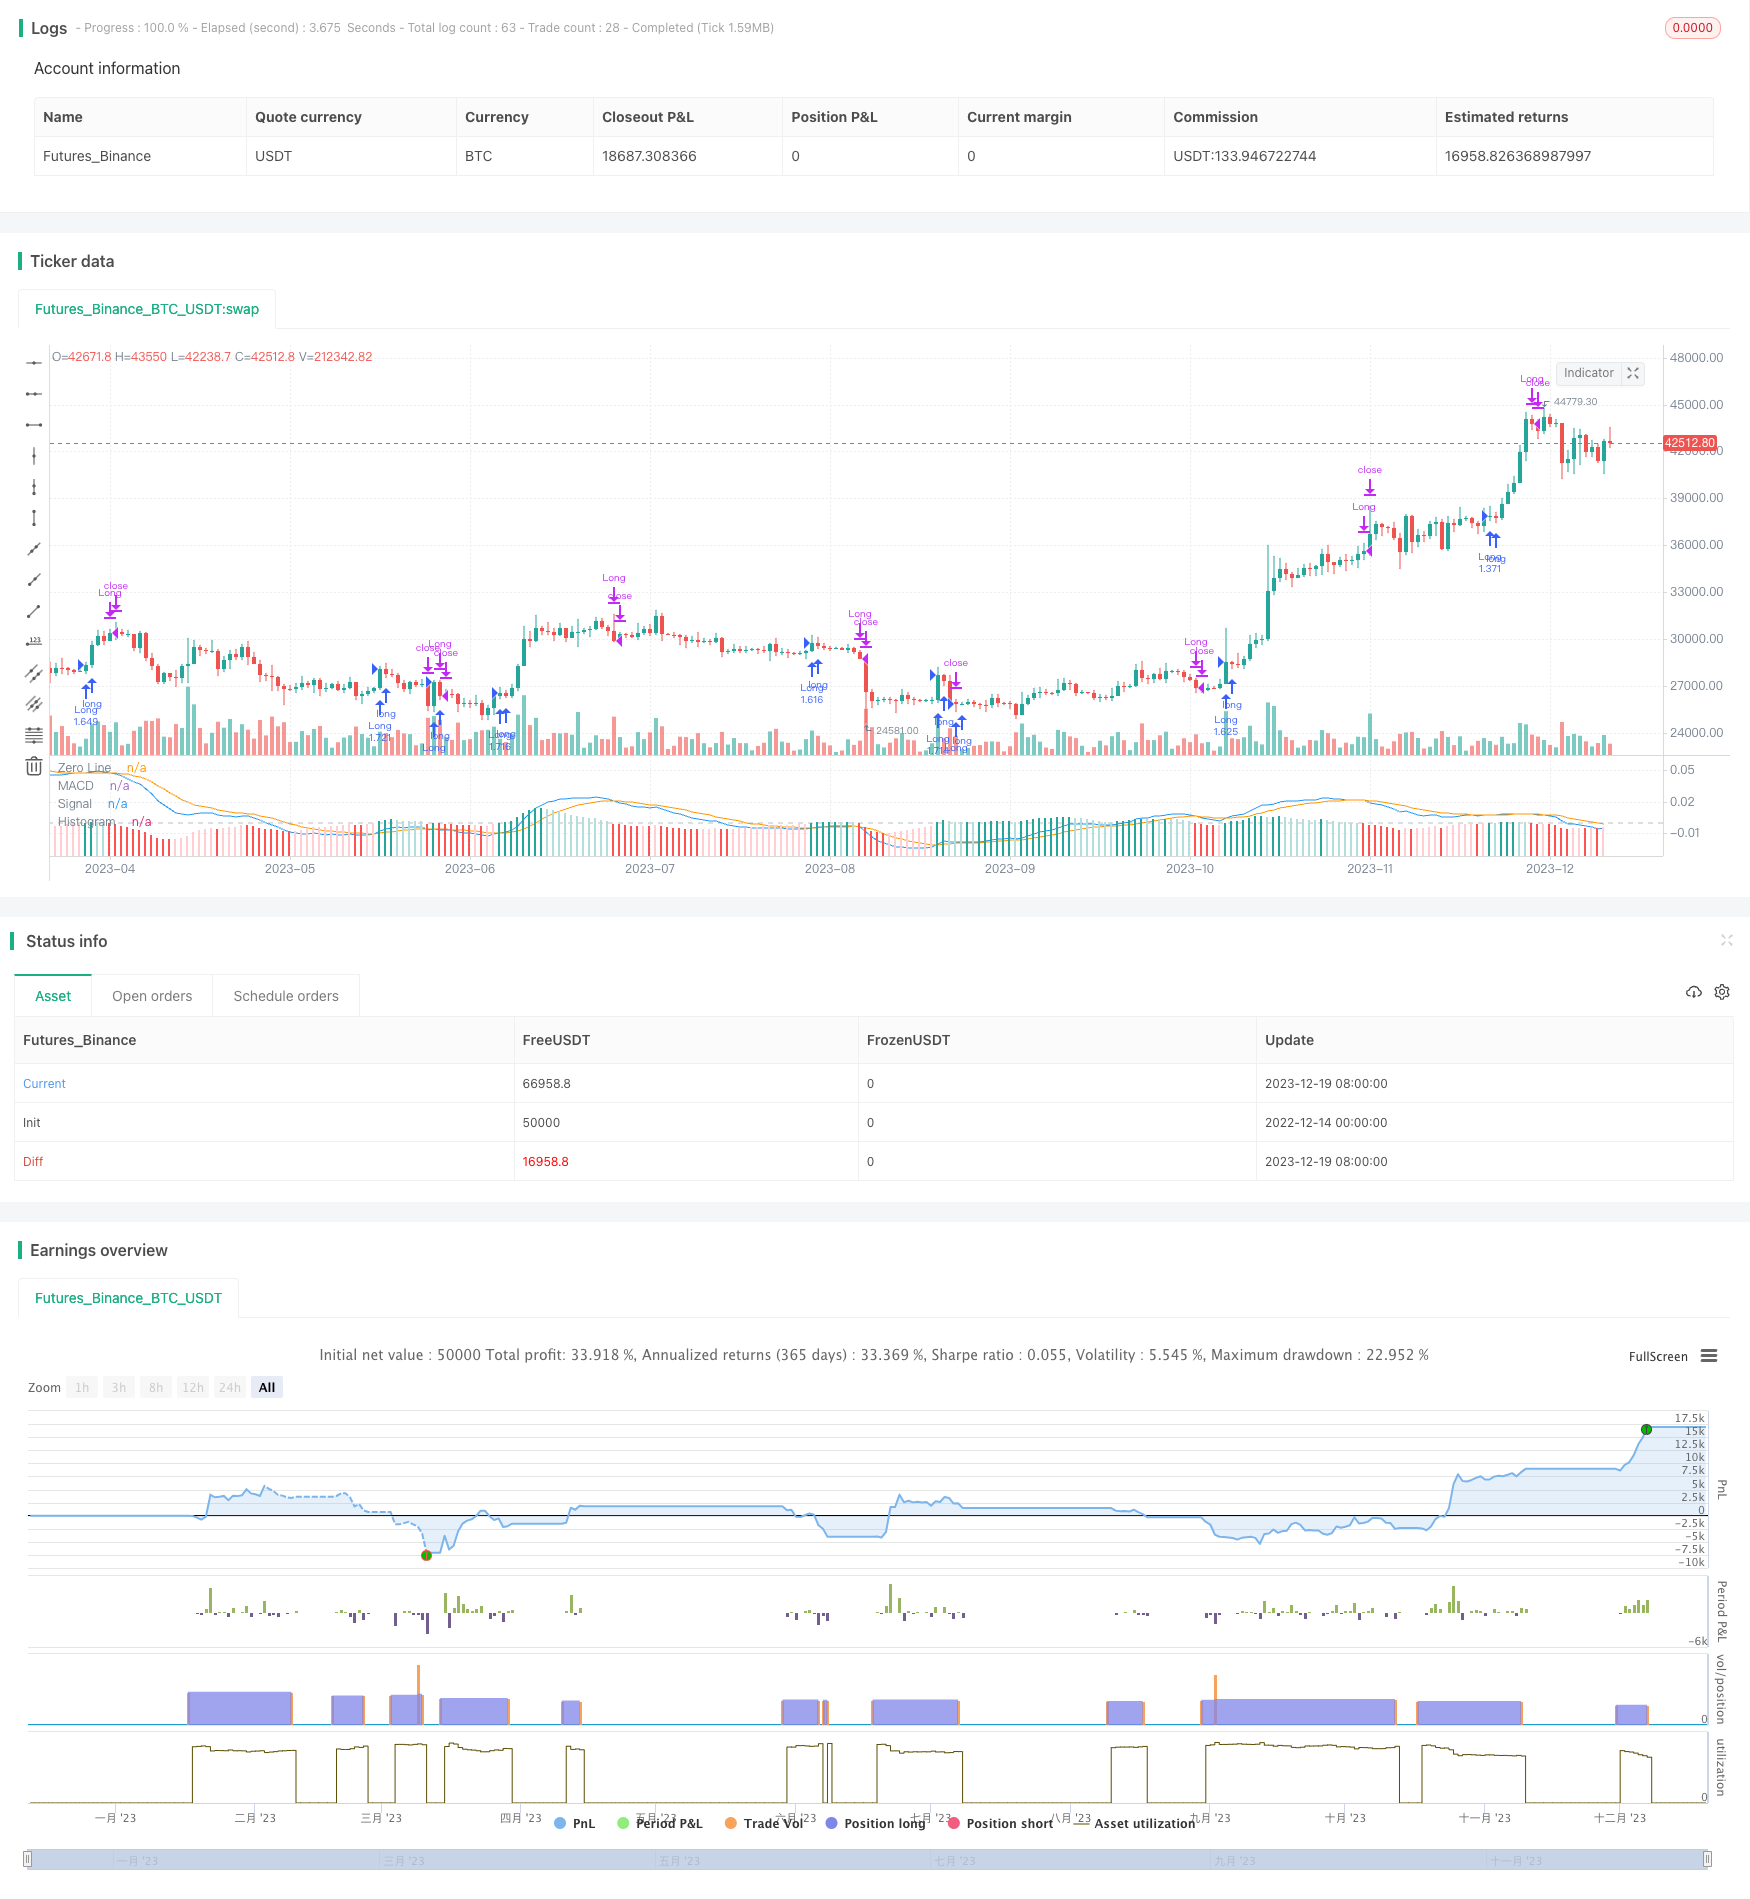
/*backtest
start: 2022-12-14 00:00:00
end: 2023-12-20 00:00:00
period: 1d
basePeriod: 1h
exchanges: [{"eid":"Futures_Binance","currency":"BTC_USDT"}]
*/

// This source code is subject to the terms of the Mozilla Public License 2.0 at https://mozilla.org/MPL/2.0/
// © gsanson66


//This strategy calculates the Relative Strength and plot the MACD of this Relative Strenght
//We take only buy signals send by MACD
//@version=5
strategy("MACD OF RELATIVE STRENGHT STRATEGY", shorttitle="MACD RS STRATEGY", precision=4, overlay=false, initial_capital=1000, default_qty_type=strategy.cash, default_qty_value=950, commission_type=strategy.commission.percent, commission_value=0.18, slippage=3)


//------------------------------TOOL TIPS--------------------------------//

t1 = "Relative Strength length i.e. number of candles back to find the highest high and compare the current price with this high."
t2 = "Relative Strength fast EMA length used to plot the MACD."
t3 = "Relative Strength slow EMA length used to plot the MACD."
t4 = "Macdline SMA length used to plot the MACD."
t5 = "The maximum loss a trade can incur (in percentage of the trade value)"
t6 = "Each gain or losse (relative to the previous reference) in an amount equal to this fixed ratio will change quantity of orders."
t7 = "The amount of money to be added to or subtracted from orders once the fixed ratio has been reached."


//----------------------------------------FUNCTIONS---------------------------------------//

//@function Displays text passed to `txt` when called.
debugLabel(txt, color, loc) =>
    label.new(bar_index, loc, text=txt, color=color, style=label.style_label_lower_right, textcolor=color.black, size=size.small)

//@function which looks if the close date of the current bar falls inside the date range
inBacktestPeriod(start, end) => (time >= start) and (time <= end)


//---------------------------------------USER INPUTS--------------------------------------//

//Technical parameters
rs_lenght = input.int(defval=300, minval=1, title="RS Length", group="Technical parameters", tooltip=t1)
fast_length = input(title="MACD Fast Length", defval=14, group="Technical parameters", tooltip=t2)
slow_length = input(title="MACD Slow Length", defval=26, group="Technical parameters", tooltip=t3)
signal_length = input.int(title="MACD Signal Smoothing",  minval=1, maxval=50, defval=10, group="Technical parameters", tooltip=t4)
//Risk Management
slMax = input.float(8, "Max risk per trade (in %)", minval=0, group="Risk Management", tooltip=t5)
//Money Management
fixedRatio = input.int(defval=400, minval=1, title="Fixed Ratio Value ($)", group="Money Management", tooltip=t6)
increasingOrderAmount = input.int(defval=200, minval=1, title="Increasing Order Amount ($)", group="Money Management", tooltip=t7)
//Backtesting period
startDate = input(title="Start Date", defval=timestamp("1 Jan 2020 00:00:00"), group="Backtesting Period")
endDate = input(title="End Date", defval=timestamp("1 July 2024 00:00:00"), group="Backtesting Period")


//----------------------------------VARIABLES INITIALISATION-----------------------------//
strategy.initial_capital = 50000
//Relative Strenght Calculation
rs = close/ta.highest(high, rs_lenght)
//MACD of RS Calculation
[macdLine, signalLine, histLine] = ta.macd(rs, fast_length, slow_length, signal_length)
//Money management
equity = math.abs(strategy.equity - strategy.openprofit)
var float capital_ref = strategy.initial_capital
var float cashOrder = strategy.initial_capital * 0.95
//Backtesting period
bool inRange = na


//------------------------------CHECKING SOME CONDITIONS ON EACH SCRIPT EXECUTION-------------------------------//

//Checking if the date belong to the range
inRange := true

//Checking performances of the strategy
if equity > capital_ref + fixedRatio
    spread = (equity - capital_ref)/fixedRatio
    nb_level = int(spread)
    increasingOrder = nb_level * increasingOrderAmount
    cashOrder := cashOrder + increasingOrder
    capital_ref := capital_ref + nb_level*fixedRatio
if equity < capital_ref - fixedRatio
    spread = (capital_ref - equity)/fixedRatio
    nb_level = int(spread)
    decreasingOrder = nb_level * increasingOrderAmount
    cashOrder := cashOrder - decreasingOrder
    capital_ref := capital_ref - nb_level*fixedRatio

//Checking if we close all trades in case where we exit the backtesting period
if strategy.position_size!=0 and not inRange
    strategy.close_all()
    debugLabel("END OF BACKTESTING PERIOD : we close the trade", color=color.rgb(116, 116, 116), loc=macdLine)


//-----------------------------------EXIT SIGNAL------------------------------//

if strategy.position_size>0 and histLine<0
    strategy.close("Long")


//-------------------------------BUY CONDITION-------------------------------------//

if histLine>0 and not (strategy.position_size>0) and inRange
    qty = cashOrder/close
    stopLoss = close*(1-slMax/100)
    strategy.entry("Long", strategy.long, qty)
    strategy.exit("Exit Long", "Long", stop=stopLoss)


//---------------------------------PLOTTING ELEMENT----------------------------------//

hline(0, "Zero Line", color=color.new(#787B86, 50))
plot(macdLine, title="MACD", color=color.blue)
plot(signalLine, title="Signal", color=color.orange)
plot(histLine, title="Histogram", style=plot.style_columns, color=(histLine>=0 ? (histLine[1] < histLine ? #26A69A : #B2DFDB) : (histLine[1] < histLine ? #FFCDD2 : #FF5252)))
plotchar(rs, "Relative Strenght", "", location.top, color=color.yellow)