モメンタム戦略のためのダブルボトムブレイクアウトモデル
概要
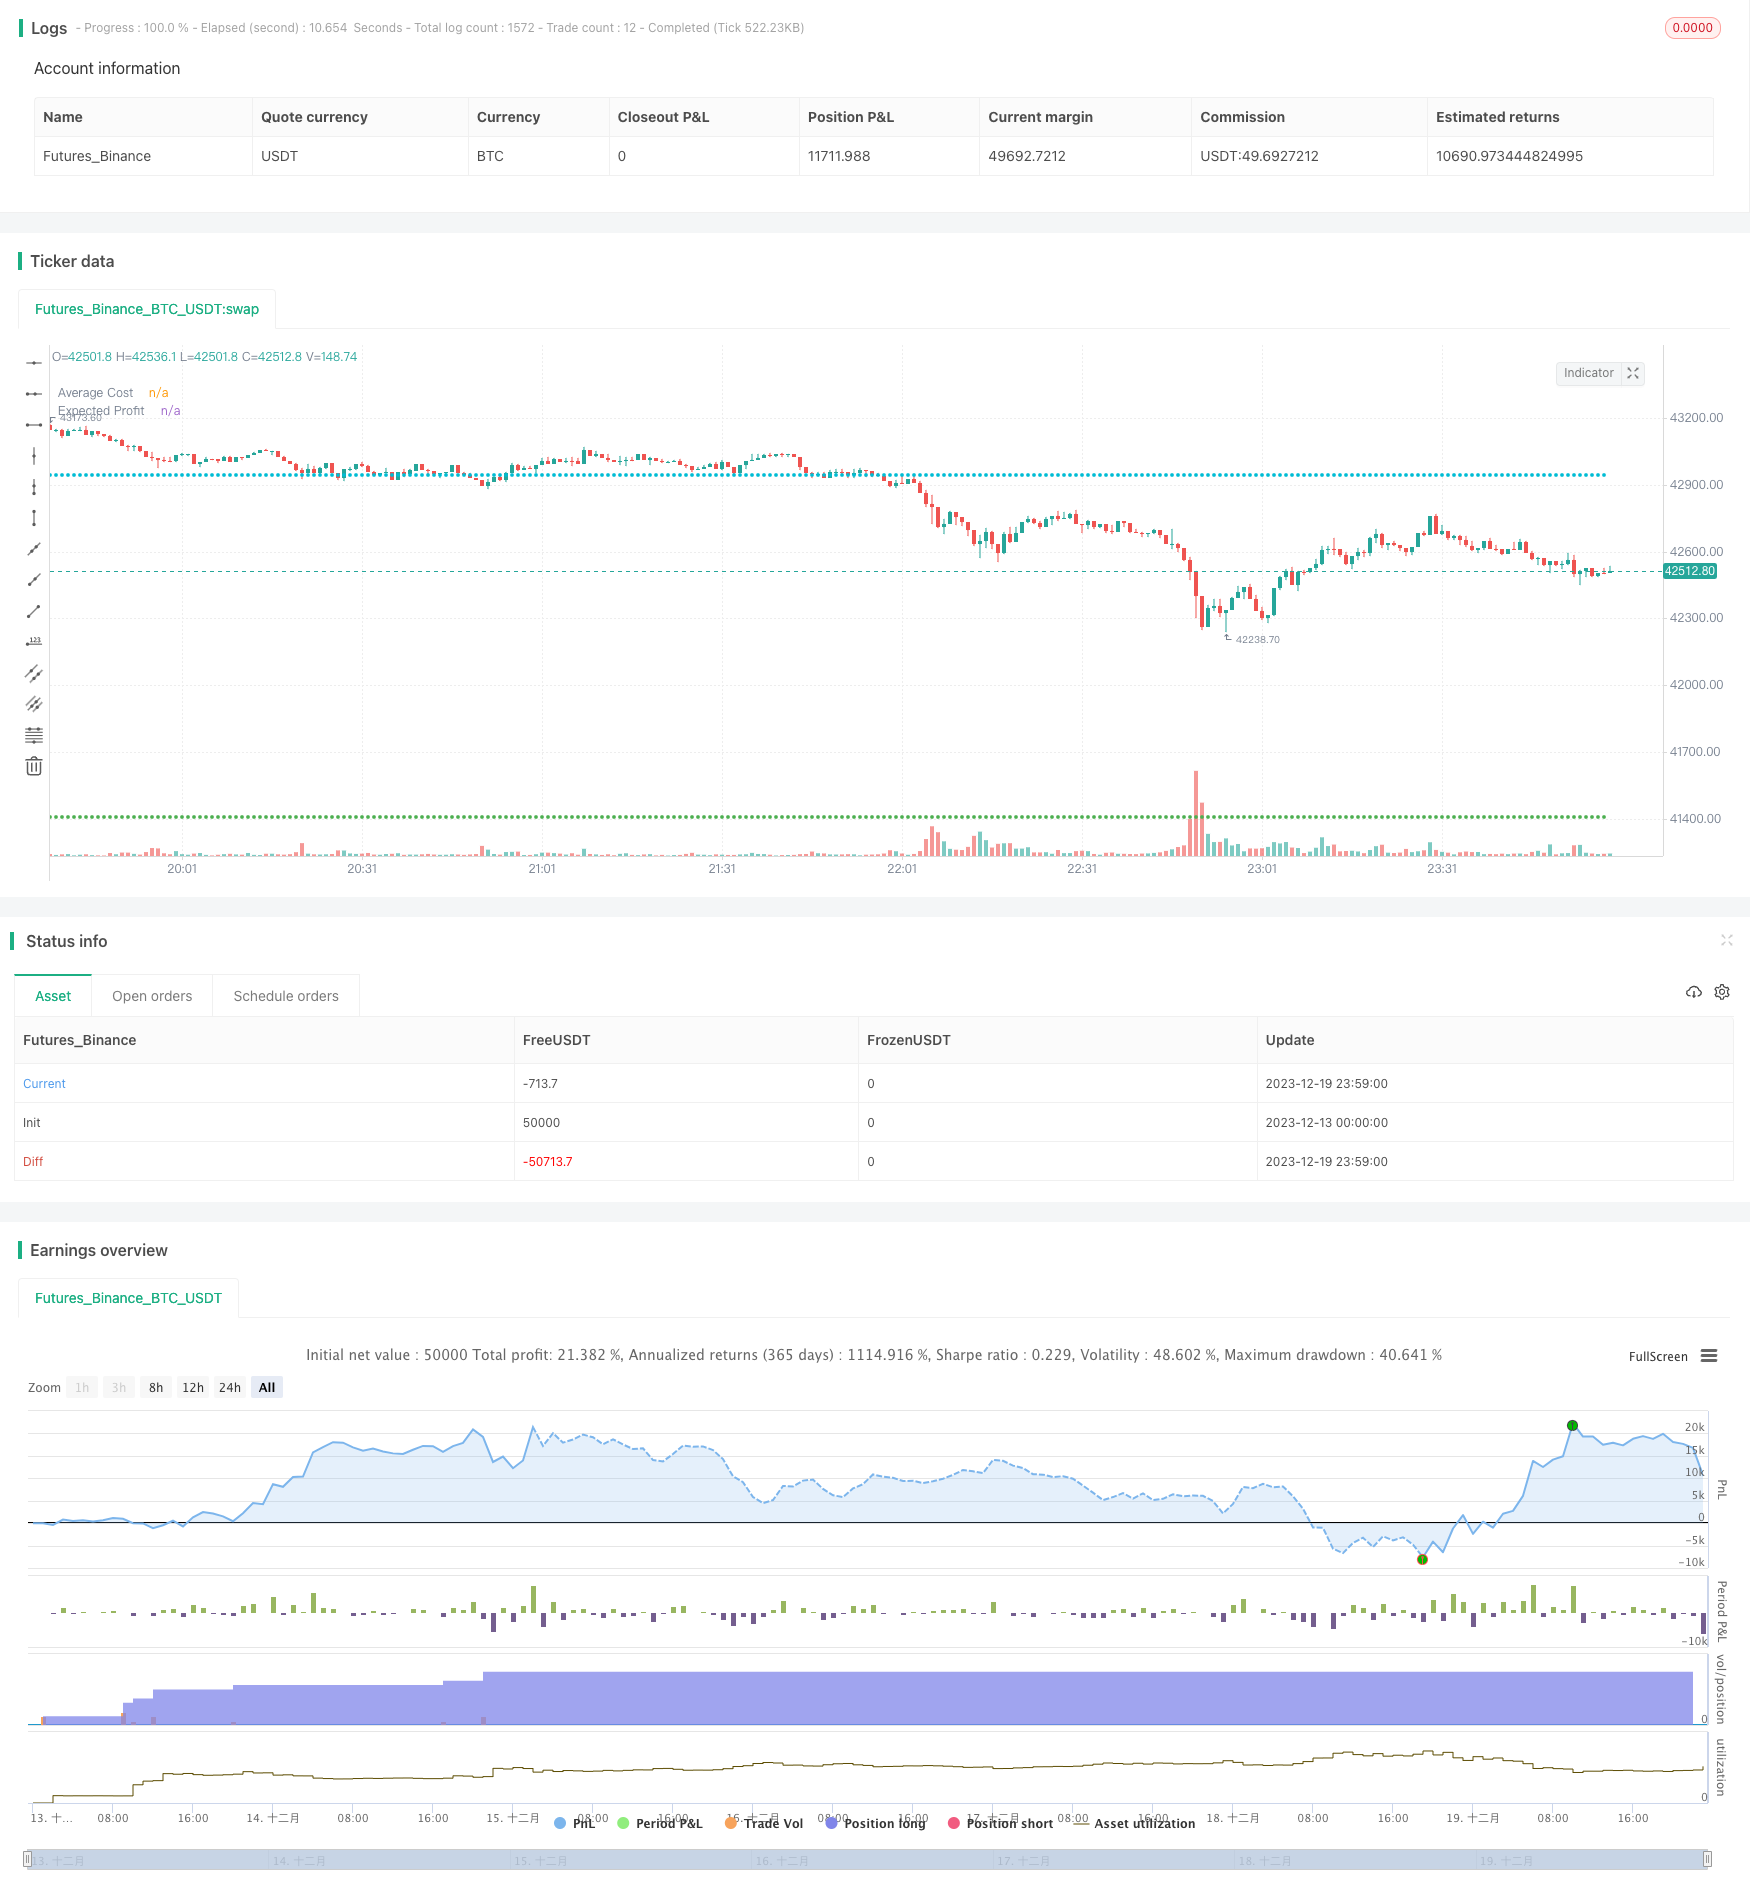
この戦略は,技術指標に基づく二底モデルで,市場が超売り状態にあるとき,底部地域が形成される二底形突破シグナルを探し,購入操作を行う.この戦略は,複数の指標を組み合わせて,市場の超売りと超買い状態を判断し,二底が形成される時に購入シグナルを発信する.この戦略は,主に中短線取引に適用される.
戦略原則
この戦略は,価格が重要なサポートの近くで二重底を形成しているかどうか,および市場が超売り状態にあるかどうかを判断する.具体的には,戦略は以下の指標を用いて判断する.
RSI指標:RSI指標が市場が超売り状態であることを示すとき,買取信号とみなされます.
RVI指数:RVI指数が市場が超売り状態であることを示すとき,買取シグナルとみなす.
MFI指数:MFI指数が市場が超売り状態であることを示すとき,買入シグナルとみなす.
SAR指標:価格が上昇してSAR指標を突破すると,買取信号とみなされます.
SMA500指数:価格が上昇してSMA500を突破すると,買入シグナルとみなされます.
この戦略は,上記の複数の指標の判断結果を総合的に考慮し,重要なサポート位の近くで二重底形が形成されたときに買い信号を発します.
戦略的優位性
この戦略の利点は以下の通りです.
市場を判断する複数の指標を組み合わせると,信号はより信頼性が高くなります.
双底形成時に買い信号を発信し,利益の確率が高い.
超売り状態を判断するために指標の組み合わせを使用し,買い取りのタイミングを間違わないようにしてください.
双底突破モデルと指標戦略を融合し,トレンドトラッキングと反転取引の優位性を兼ね備えています.
戦略パラメータの最適化スペースは広く,異なる市場に応じてパラメータを調整できます.
戦略リスク
この戦略には以下のリスクもあります.
指数は偽信号を発信し,購入損失のリスクを引き起こす可能性.パラメータを最適化することで偽信号を減らすことができます.
双底が突破に失敗するリスク. 単一損失を減らすため,ストップポイントを設定できます.
高次元のパラメータを最適化することは困難で,大量の歴史データが必要である.ステップアップアルゴリズムを用いて段階的に最適化することができる.
歴史的データテストの結果によって,リディスクの効果は異なる。異なる市場での検証が必要。
最適化の方向
戦略の主要な最適化方向は以下の通りです.
購入指標の重みを最適化して,最適の重み組み合わせを決定する.
指数パラメータを最適化して,最適なパラメータ組み合わせを決定する.
ストップ・ロスの戦略を導入し,単発損失を減らす.
ポジション管理モジュールが追加され,収益が安定した.
機械学習アルゴリズムと組み合わせた自己適応パラメータ最適化メカニズムを確立する.
要約する
この戦略は双底突破モデルと超売り指標の判断を統合し,キーサポート位の近くで双底が形成されたときに買い信号を発する.最適化スペースが大きく,重量,パラメータ,ストップ,ポジションなどの調整が可能で,戦略はより安定し,信頼性が高く,実戦価値が高くなる.
/*backtest
start: 2023-12-13 00:00:00
end: 2023-12-20 00:00:00
period: 1m
basePeriod: 1m
exchanges: [{"eid":"Futures_Binance","currency":"BTC_USDT"}]
*/


//@version=5

strategy("UP & DOWN -  BNB/USDT 15min", shorttitle="U&D - BNB 15min", overlay=true, calc_on_order_fills=true, calc_on_every_tick=true, initial_capital = 1000,pyramiding = 40,backtest_fill_limits_assumption = 1, process_orders_on_close=true, currency = currency.USD, default_qty_type = strategy.cash, default_qty_value = 25, commission_type = strategy.commission.percent, commission_value = 0.1)

// This startergy optimized to BNB 15 min standerd candlestic chart and buy & sell signals were based on technical analysis.

UP_DOWN = input.string( title='Trade in', options=['Only on Up Trends', 'Uptrend and down trend'], defval='Uptrend and down trend')
var profit_cal = input.float( defval = 3.7, title = "Expected profit %", minval = 0.2, step = 0.1)

//Backtest dates
fromMonth = input.int(defval = 10,title = "From Month", minval = 1, maxval = 12, group = 'Time Period Values')
fromDay   = input.int(defval = 1,    title = "From Day", minval = 1, maxval = 31, group = 'Time Period Values')
fromYear  = input.int(defval = 2021, title = "From Year", minval = 1970, group = 'Time Period Values')
thruMonth = input.int(defval = 1,    title = "Thru Month", minval = 1, maxval = 12, group = 'Time Period Values')
thruDay   = input.int(defval = 1,    title = "Thru Day", minval = 1, maxval = 31, group = 'Time Period Values')
thruYear  = input.int(defval = 2112, title = "Thru Year", minval = 1970, group = 'Time Period Values')

//showDate  = input(defval = true, title = "Show Date Range", group = 'Time Period Values')

start     = timestamp(fromYear, fromMonth, fromDay, 00, 00)        // backtest start window
finish    = timestamp(thruYear, thruMonth, thruDay, 23, 59)        // backtest finish window
window()  => true

// inputs
//Inputs of SAR Indicator
sar1 = input.float(defval=0.0002, title='SAR value 1',step=0.0001, group = 'SAR Values')
sar2 = input.float(defval=0.0004, title='SAR value 2',step=0.0001, group = 'SAR Values')
sar3 = input.float(defval=0.1, title='SAR value 3',step=0.1, group = 'SAR Values')
src_close = input(close, "SAR Source - close", group = 'SAR Values')
src_open = input(open, "SAR Source - open", group = 'SAR Values')
bool sar_visible = input(false, "Show SAR",group = 'SAR Values' )
// Inputs of Super trend indicator
ST_T = input.int(defval=16, title = 'Supertrend - Trend', step =1, group = 'Super Trend')
ST_D = input.int(defval=7, title = 'Supertrend - Direction', step =1, group = 'Super Trend')
ST_SMA = input.int(defval=1, title = 'Supertrend - SMA', step = 1, group = 'Super Trend')
bool ST_visible = input(false, "Show Super Trend",group = 'Super Trend' )
//Inputs of SMA500 indicator
src_sma500 = input(high, 'SMA500 - Source', group = 'SMA500')
lb_sma500 = input.int(defval = 143, title = 'SMA500 - Look back period', step=10, group = 'SMA500')
bool sma500_visible = input(false, "Show SMA500",group = 'SMA500' )


// Calculations
// SMA500 Indicator
SMA500 = ta.sma(src_sma500,lb_sma500)
SMA700 = ta.sma(close,700)
SMA_Open = ta.sma(open,9)
//SMA9 Indicator
SMA9 = ta.sma((high+low)/2,5)
risingSMA9 = ta.rising(SMA9,1)
fallingSMA9 = ta.falling(SMA9,1)
color  plotcolor1 = color.black
if risingSMA9
    plotcolor1 := color.green

// SAR Indicator
sar = ta.sar(sar1, sar2, sar3)
sma2_close = ta.sma(src_close,1)
sma2_open = ta.sma(src_open,1)

//Supertrend
[supertrend, direction] = ta.supertrend(ST_T, ST_D)
up_trend = ta.sma(direction < 0 ? supertrend : na,ST_SMA)
down_trend = ta.sma(direction < 0? na : supertrend, ST_SMA)

// Color change
color  plotcolor2 = color.green
if open>down_trend or close>down_trend
    plotcolor2 := color.lime
if open<down_trend or close<down_trend
    plotcolor2 := color.red

color plotcolor3 = color.green
if open>up_trend or close>up_trend
    plotcolor3 := color.yellow
if open<up_trend or close<up_trend
    plotcolor3 := color.red

color plotcolor4 = color.black
if (open>sar or close>sar)
    plotcolor4 := color.white
if (open<sar or close<sar)
    plotcolor4 := color.red

color plotcolor5 = color.black
if (open>SMA500 or close>SMA500)
    plotcolor5 := color.green
if (open<SMA500 or close<SMA500)
    plotcolor5 := color.red

color plotcolor6 = color.green
rising_taalma = ta.rising (ta.alma(open,10,.99,1),1)
falling_taalma = ta.falling (ta.alma(open,10,.99,1),1)

if rising_taalma
    plotcolor6 := color.green
if falling_taalma
    plotcolor6 := color.red

// buy and sell conditions for uptrend

longCondition1 = (open >= down_trend or high>= down_trend or ta.crossover(open,down_trend)or ta.crossover(high,down_trend))
longCondition2 = (open >= up_trend or high>= up_trend or ta.crossover(open,up_trend)or ta.crossover(high,up_trend))
longCondition3 = (open >= SMA500 or high>= SMA500 or ta.crossover(open,SMA500)or ta.crossover(high,SMA500))
longCondition4 = (open >= sar or high>= sar or ta.crossover(open,sar)or ta.crossover(high,sar))
longCondition5 = rising_taalma

shortCondition1 = (close < down_trend or low< down_trend or ta.crossunder(close,down_trend)or ta.crossunder(low,down_trend))
shortCondition2 = (close < up_trend or low< up_trend or ta.crossunder(close,up_trend)or ta.crossunder(low,up_trend))
shortCondition3 = (close < SMA500 or low< SMA500 or ta.crossunder(close,SMA500)or ta.crossunder(low,SMA500))
shortCondition4 = (close < sar or low< sar or ta.crossunder(close,sar)or ta.crossunder(low,sar))
shortCondition5 = falling_taalma

comp_buy1 = longCondition1 and longCondition2 and longCondition3 and longCondition4 and longCondition5
op_buy1 = shortCondition3 and longCondition1 and longCondition2 and longCondition4
op_buy2 = shortCondition1 and shortCondition2 and longCondition3 and longCondition4 and longCondition5

comp_sell1 = shortCondition1 and shortCondition2 and shortCondition3 and shortCondition4 and shortCondition5
op_sell1 = shortCondition3 and shortCondition4 and longCondition1 and longCondition2
op_sell2 = shortCondition4 and longCondition1 and longCondition2 and longCondition3
op_sell3 = longCondition2 and shortCondition1 and shortCondition4 and shortCondition3
op_sell4 = longCondition2 and shortCondition1 and shortCondition4

var b1 = 0
var b2 = 0
var b3 = 0

if comp_buy1 == true and comp_buy1[1] == false
    b1 := 1
else
    b1 := 0


if op_buy1 == true and op_buy1[1] == false
    b2 := 1
else
    b2 := 0


if op_buy2 == true and op_buy2[1] == false
    b3 := 1
else
    b3 := 0

// DCA method based on indicators

//RSI Indicator
len_rsi_10 = input.int(10,  title="Length", group = "RSI Indicator - 10", minval=1, maxval = 10, step = 1)
src_rsi_10 = input(ohlc4, "Source", group = "RSI Indicator - 10")
up_rsi_10 = ta.rma(math.max(ta.change(src_rsi_10), 0), len_rsi_10)
down_rsi_10 = ta.rma(-math.min(ta.change(src_rsi_10), 0), len_rsi_10)
rsi_10 = down_rsi_10 == 0 ? 100 : up_rsi_10 == 0 ? 0 : 100 - (100 / (1 + up_rsi_10 / down_rsi_10))

var p_rsi = 0

if rsi_10>= 0 and rsi_10<10
    p_rsi := 0
else if rsi_10>= 10 and rsi_10<20
    p_rsi := 10
else if rsi_10>= 20 and rsi_10<30
    p_rsi := 20
else if rsi_10>= 30 and rsi_10<40
    p_rsi := 30
else if rsi_10>= 40 and rsi_10<50
    p_rsi := 40
else if rsi_10>= 50 and rsi_10<60
    p_rsi := 50
else if rsi_10>= 60 and rsi_10<70
    p_rsi := 60
else if rsi_10>= 70 and rsi_10<80
    p_rsi := 70
else if rsi_10>= 80 and rsi_10<90
    p_rsi := 80
else if rsi_10>= 90 and rsi_10<100
    p_rsi := 90

len_rsi_50 = input.int(50, title="Length", group = "RSI Indicator - 50", minval=11, maxval = 50, step = 1)
src_rsi_50 = input(high, "Source", group = "RSI Indicator - 50")
up_rsi_50 = ta.rma(math.max(ta.change(src_rsi_50), 0), len_rsi_50)
down_rsi_50 = ta.rma(-math.min(ta.change(src_rsi_50), 0), len_rsi_50)
rsi_50 = down_rsi_50 == 0 ? 100 : up_rsi_50 == 0 ? 0 : 100 - (100 / (1 + up_rsi_50 / down_rsi_50))

var p_rsi_50 = 0

if rsi_50>= 0 and rsi_50<10
    p_rsi_50 := 0
else if rsi_50>= 10 and rsi_50<20
    p_rsi_50 := 10
else if rsi_50>= 20 and rsi_50<30
    p_rsi_50 := 20
else if rsi_50>= 30 and rsi_50<40
    p_rsi_50 := 30
else if rsi_50>= 40 and rsi_50<50
    p_rsi_50 := 40
else if rsi_50>= 50 and rsi_50<60
    p_rsi_50 := 50
else if rsi_50>= 60 and rsi_50<70
    p_rsi_50 := 60
else if rsi_50>= 70 and rsi_50<80
    p_rsi_50 := 70
else if rsi_50>= 80 and rsi_50<90
    p_rsi_50 := 80
else if rsi_50>= 90 and rsi_50<100
    p_rsi_50 := 90

len_rsi_100 = input.int(100, title="Length", group = "RSI Indicator - 100", minval=51, maxval = 200, step = 10)
src_rsi_100 = input(ohlc4, "Source", group = "RSI Indicator - 100")
up_rsi_100 = ta.rma(math.max(ta.change(src_rsi_100), 0), len_rsi_100)
down_rsi_100 = ta.rma(-math.min(ta.change(src_rsi_100), 0), len_rsi_100)
rsi_100 = down_rsi_100 == 0 ? 100 : up_rsi_100 == 0 ? 0 : 100 - (100 / (1 + up_rsi_100 / down_rsi_100))

var p_rsi_100 = 0

if rsi_100>= 0 and rsi_100<10
    p_rsi_100 := 0
else if rsi_100>= 10 and rsi_100<20
    p_rsi_100 := 10
else if rsi_100>= 20 and rsi_100<30
    p_rsi_100 := 20
else if rsi_100>= 30 and rsi_100<40
    p_rsi_100 := 30
else if rsi_100>= 40 and rsi_100<50
    p_rsi_100 := 40
else if rsi_100>= 50 and rsi_100<60
    p_rsi_100 := 50
else if rsi_100>= 60 and rsi_100<70
    p_rsi_100 := 60
else if rsi_100>= 70 and rsi_100<80
    p_rsi_100 := 70
else if rsi_100>= 80 and rsi_100<90
    p_rsi_100 := 80
else if rsi_100>= 90 and rsi_100<100
    p_rsi_100 := 90

// Relative Volatility Indicator
length_rvi_10 = input.int(defval = 10, minval=1, maxval = 10, step = 1, title="Length - RVI", group = "RVI Indicator - 10")
len_rvi_10 = input.int(defval = 10, minval=1, maxval = 10, step = 1, title="Length - EMA", group = "RVI Indicator - 10")
src_rvi_10 = input(high, title = "Source", group = "RVI Indicator - 10")
stddev_rvi_10 = ta.stdev(src_rvi_10, length_rvi_10)
upper_rvi_10 = ta.ema(ta.change(src_rvi_10) <= 0 ? 0 : stddev_rvi_10, len_rvi_10)
lower_rvi_10 = ta.ema(ta.change(src_rvi_10) > 0 ? 0 : stddev_rvi_10, len_rvi_10)
rvi_10 = upper_rvi_10 / (upper_rvi_10 + lower_rvi_10) * 100

var p_rvi_10 = 0

if rvi_10 >= 0 and rvi_10 <10
    p_rvi_10 := 0
else if rvi_10 >= 10 and rvi_10 <20
    p_rvi_10 := 10
else if rvi_10 >= 20 and rvi_10 <30
    p_rvi_10 := 20
else if rvi_10 >= 30 and rvi_10 <40
    p_rvi_10 := 30
else if rvi_10 >= 40 and rvi_10 <50
    p_rvi_10 := 40
else if rvi_10 >= 50 and rvi_10 <60
    p_rvi_10 := 50
else if rvi_10 >= 60 and rvi_10 <70
    p_rvi_10 := 60
else if rvi_10 >= 70 and rvi_10 <80
    p_rvi_10 := 70
else if rvi_10 >= 80 and rvi_10 <90
    p_rvi_10 := 80
else if rvi_10 >= 90 and rvi_10 <100
    p_rvi_10 := 90

length_rvi_50 = input.int(defval = 50, minval=11, maxval = 50, step = 1, title="Length - RVI", group = "RVI Indicator - 50")
len_rvi_50 = input.int(defval = 50, minval=11, maxval = 50, step = 1, title="Length - EMA", group = "RVI Indicator - 50")
src_rvi_50 = input(close, title = "source", group = "RVI Indicator - 50")
stddev_rvi_50 = ta.stdev(src_rvi_50, length_rvi_50)
upper_rvi_50 = ta.ema(ta.change(src_rvi_50) <= 0 ? 0 : stddev_rvi_50, len_rvi_50)
lower_rvi_50 = ta.ema(ta.change(src_rvi_50) > 0 ? 0 : stddev_rvi_50, len_rvi_50)
rvi_50 = upper_rvi_50 / (upper_rvi_50 + lower_rvi_50) * 100

var p_rvi_50 = 0

if rvi_50 >= 0 and rvi_50 <10
    p_rvi_50 := 0
else if rvi_50 >= 10 and rvi_50 <20
    p_rvi_50 := 10
else if rvi_50 >= 20 and rvi_50 <30
    p_rvi_50 := 20
else if rvi_50 >= 30 and rvi_50 <40
    p_rvi_50 := 30
else if rvi_50 >= 40 and rvi_50 <50
    p_rvi_50 := 40
else if rvi_50 >= 50 and rvi_50 <60
    p_rvi_50 := 50
else if rvi_50 >= 60 and rvi_50 <70
    p_rvi_50 := 60
else if rvi_50 >= 70 and rvi_50 <80
    p_rvi_50 := 70
else if rvi_50 >= 80 and rvi_50 <90
    p_rvi_50 := 80
else if rvi_50 >= 90 and rvi_50 <100
    p_rvi_50 := 90


length_rvi_100 = input.int(defval = 100, minval=51, maxval = 200, step = 10, title="Length - RVI", group = "RVI Indicator - 100")
len_rvi_100 = input.int(defval = 100, minval=51, maxval = 200, step = 10, title="Length - EMA", group = "RVI Indicator - 100")
src_rvi_100 = input(close, title = "Source", group = "RVI Indicator - 100")
stddev_rvi_100 = ta.stdev(src_rvi_100, length_rvi_100)
upper_rvi_100 = ta.ema(ta.change(src_rvi_100) <= 0 ? 0 : stddev_rvi_100, len_rvi_100)
lower_rvi_100 = ta.ema(ta.change(src_rvi_100) > 0 ? 0 : stddev_rvi_100, len_rvi_100)
rvi_100 = upper_rvi_100 / (upper_rvi_100 + lower_rvi_100) * 100


var p_rvi_100 = 0

if rvi_100 >= 0 and rvi_100 <10
    p_rvi_100 := 0
else if rvi_100 >= 10 and rvi_100 <20
    p_rvi_100 := 10
else if rvi_100 >= 20 and rvi_100 <30
    p_rvi_100 := 20
else if rvi_100 >= 30 and rvi_100 <40
    p_rvi_100 := 30
else if rvi_100 >= 40 and rvi_100 <50
    p_rvi_100 := 40
else if rvi_100 >= 50 and rvi_100 <60
    p_rvi_100 := 50
else if rvi_100 >= 60 and rvi_100 <70
    p_rvi_100 := 60
else if rvi_100 >= 70 and rvi_100 <80
    p_rvi_100 := 70
else if rvi_100 >= 80 and rvi_100 <90
    p_rvi_100 := 80
else if rvi_100 >= 90 and rvi_100 <100
    p_rvi_100 := 90

// Money flow index
len_mfi_10 = input.int(defval = 10, minval=1, maxval = 10, step = 1, title="Length - MFI", group = "MFI Indicator - 10")
src_mfi_10 = input(high, title = "source", group = "MFI Indicator - 10")
mf_10 = ta.mfi(src_mfi_10, len_mfi_10)

var p_mfi_10 = 0

if mf_10>= 0 and mf_10<10
    p_mfi_10 := 0
else if mf_10>= 10 and mf_10<20
    p_mfi_10 := 10
else if mf_10>= 20 and mf_10<30
    p_mfi_10 := 20
else if mf_10>= 30 and mf_10<40
    p_mfi_10 := 30
else if mf_10>= 40 and mf_10<50
    p_mfi_10 := 40
else if mf_10>= 50 and mf_10<60
    p_mfi_10 := 50
else if mf_10>= 60 and mf_10<70
    p_mfi_10 := 60
else if mf_10>= 70 and mf_10<80
    p_mfi_10 := 70
else if mf_10>= 80 and mf_10<90
    p_mfi_10 := 80
else if mf_10>= 90 and mf_10<100
    p_mfi_10 := 90

len_mfi_50 = input.int(defval = 50, minval=11, maxval = 50, step = 1, title="Length - MFI", group = "MFI Indicator - 50")
src_mfi_50 = input(high, title = "source", group = "MFI Indicator - 50")
mf_50 = ta.mfi(src_mfi_50, len_mfi_50)

var p_mfi_50 = 0

if mf_50>= 0 and mf_50<10
    p_mfi_50 := 0
else if mf_50>= 10 and mf_50<20
    p_mfi_50 := 10
else if mf_50>= 20 and mf_50<30
    p_mfi_50 := 20
else if mf_50>= 30 and mf_50<40
    p_mfi_50 := 30
else if mf_50>= 40 and mf_50<50
    p_mfi_50 := 40
else if mf_50>= 50 and mf_50<60
    p_mfi_50 := 50
else if mf_50>= 60 and mf_50<70
    p_mfi_50 := 60
else if mf_50>= 70 and mf_50<80
    p_mfi_50 := 70
else if mf_50>= 80 and mf_50<90
    p_mfi_50 := 80
else if mf_50>= 90 and mf_50<100
    p_mfi_50 := 90

len_mfi_100 = input.int(defval = 100, minval=51, maxval = 200, step = 10, title="Length - MFI", group = "MFI Indicator - 100")
src_mfi_100 = input(high, title = "source", group = "MFI Indicator - 100")
mf_100 = ta.mfi(src_mfi_100, len_mfi_100)

var p_mfi_100 = 0

if mf_100>= 0 and mf_100<10
    p_mfi_100 := 0
else if mf_100>= 10 and mf_100<20
    p_mfi_100 := 10
else if mf_100>= 20 and mf_100<30
    p_mfi_100 := 20
else if mf_100>= 30 and mf_100<40
    p_mfi_100 := 30
else if mf_100>= 40 and mf_100<50
    p_mfi_100 := 40
else if mf_100>= 50 and mf_100<60
    p_mfi_100 := 50
else if mf_100>= 60 and mf_100<70
    p_mfi_100 := 60
else if mf_100>= 70 and mf_100<80
    p_mfi_100 := 70
else if mf_100>= 80 and mf_100<90
    p_mfi_100 := 80
else if mf_100>= 90 and mf_100<100
    p_mfi_100 := 90

//Balance of power indicator
bop = ((((close - open) / (high - low))*100)+50)
bop_sma_100 = ta.sma(bop,100)


// Buy and Sell lavels based on Indicators
l_val_rsi = input.int (defval = 40, title = "Lower value of RSI", maxval = 100, minval = 0, step = 10, group = 'Indicator Values')
l_val_rvi = input.int (defval = 40, title = "Lower value of RVI", maxval = 100, minval = 0, step = 10, group = 'Indicator Values')
l_val_mfi = input.int (defval = 40, title = "Lower value of MFI", maxval = 100, minval = 0, step = 10, group = 'Indicator Values')

//h_val_rsi = input.int (defval = 60, title = "Higher value of RSI", maxval = 100, minval = 0, step = 10, group = 'Indicator Values')
//h_val_rvi = input.int (defval = 50, title = "Higher value of RVI", maxval = 100, minval = 0, step = 10, group = 'Indicator Values')
//h_val_mfi = input.int (defval = 50, title = "Higher value of MFI", maxval = 100, minval = 0, step = 10, group = 'Indicator Values')

buy_rsi = p_rsi_100 <= l_val_rsi and p_rsi_50<p_rsi_100 and p_rsi<=p_rsi_50
buy_rvi = p_rvi_100 <= l_val_rvi and p_rvi_50<=p_rvi_100 and p_rvi_10<=p_rvi_50
buy_mfi = p_mfi_100 <= l_val_mfi and p_mfi_50<=p_mfi_100 and p_mfi_10<=p_mfi_50

buy_compound = buy_rsi and buy_rvi and buy_mfi ? 100 : 0

var float  buy_compound_f = na
if (buy_compound[1] == 100 and buy_compound == 0) //and open > close
    buy_compound_f := 1
else
    buy_compound_f := na

ma_9 = ta.ema(close,2)
co_l1 = strategy.position_avg_price*0.95
co_l2 = strategy.position_avg_price*0.90
co_l3 = strategy.position_avg_price*0.85
co_l4 = strategy.position_avg_price*0.80

//Take profit in Market bottoms
profit_f = 1.0 + (profit_cal/100)


// Trading
var final_option = UP_DOWN == 'Uptrend and down trend' ? 1 : 2

if final_option == 1
    if  ((buy_compound_f ==1 or ta.crossover(ma_9, co_l1) or ta.crossover(ma_9, co_l2) or ta.crossover(ma_9, co_l3) or ta.crossover(ma_9, co_l4)) and window())
        strategy.entry("long", strategy.long,comment = "BUY")
    else if ( comp_sell1 and window()) and strategy.position_avg_price * profit_f < close
        strategy.close("long", qty_percent = 100, comment = "SELL")
else if final_option == 2
    if (b1 or b2 or b3) and window()
        strategy.entry("long", strategy.long, comment = "BUY")
    else if (comp_sell1 or op_sell1 or op_sell2 or op_sell3 or op_sell4 ) and window()
        strategy.close("long", qty_percent = 100, comment = "SELL")


bool PM_visible = input(false, "Show Profit marjin and average price", group = 'Safty Margins')
bool SM_visible = input(false, "Show Safty Grids", group = 'Safty Margins' )


//Graphs

plot(PM_visible or final_option == 1 ? strategy.position_avg_price : na, color = color.green, title = "Average Cost", style = plot.style_circles)
plot(PM_visible or final_option == 1 ? strategy.position_avg_price* profit_f :na, color = color.aqua, title = "Expected Profit", style = plot.style_circles)
plot(SM_visible ? strategy.position_avg_price*0.95 : na, color = color.gray, title = "SAFTY MARGIN - 95%", linewidth = 1, style = plot.style_circles)
plot(SM_visible ? strategy.position_avg_price*0.90 : na, color = color.gray, title = "SAFTY MARGIN - 90%", linewidth = 1, style = plot.style_circles)
plot(SM_visible ? strategy.position_avg_price*0.85 : na, color = color.gray, title = "SAFTY MARGIN - 85%", linewidth = 1, style = plot.style_circles)
plot(SM_visible ? strategy.position_avg_price*0.80 : na, color = color.gray, title = "SAFTY MARGIN - 80%", linewidth = 1, style = plot.style_circles)

plot(ST_visible or final_option == 2 ? down_trend:na, "Down trend", color = plotcolor2,  linewidth=2)
plot(ST_visible or final_option == 2 ? up_trend: na , "Up direction", color = plotcolor3, linewidth=2)
plot(sar_visible or final_option == 2 ? sar:na, title='SAR', color=plotcolor4, linewidth=2)
plot(sma500_visible or final_option == 2 ? SMA500:na,title='SMA500', color=plotcolor5, linewidth=3)