二重移動平均反転戦略
概要
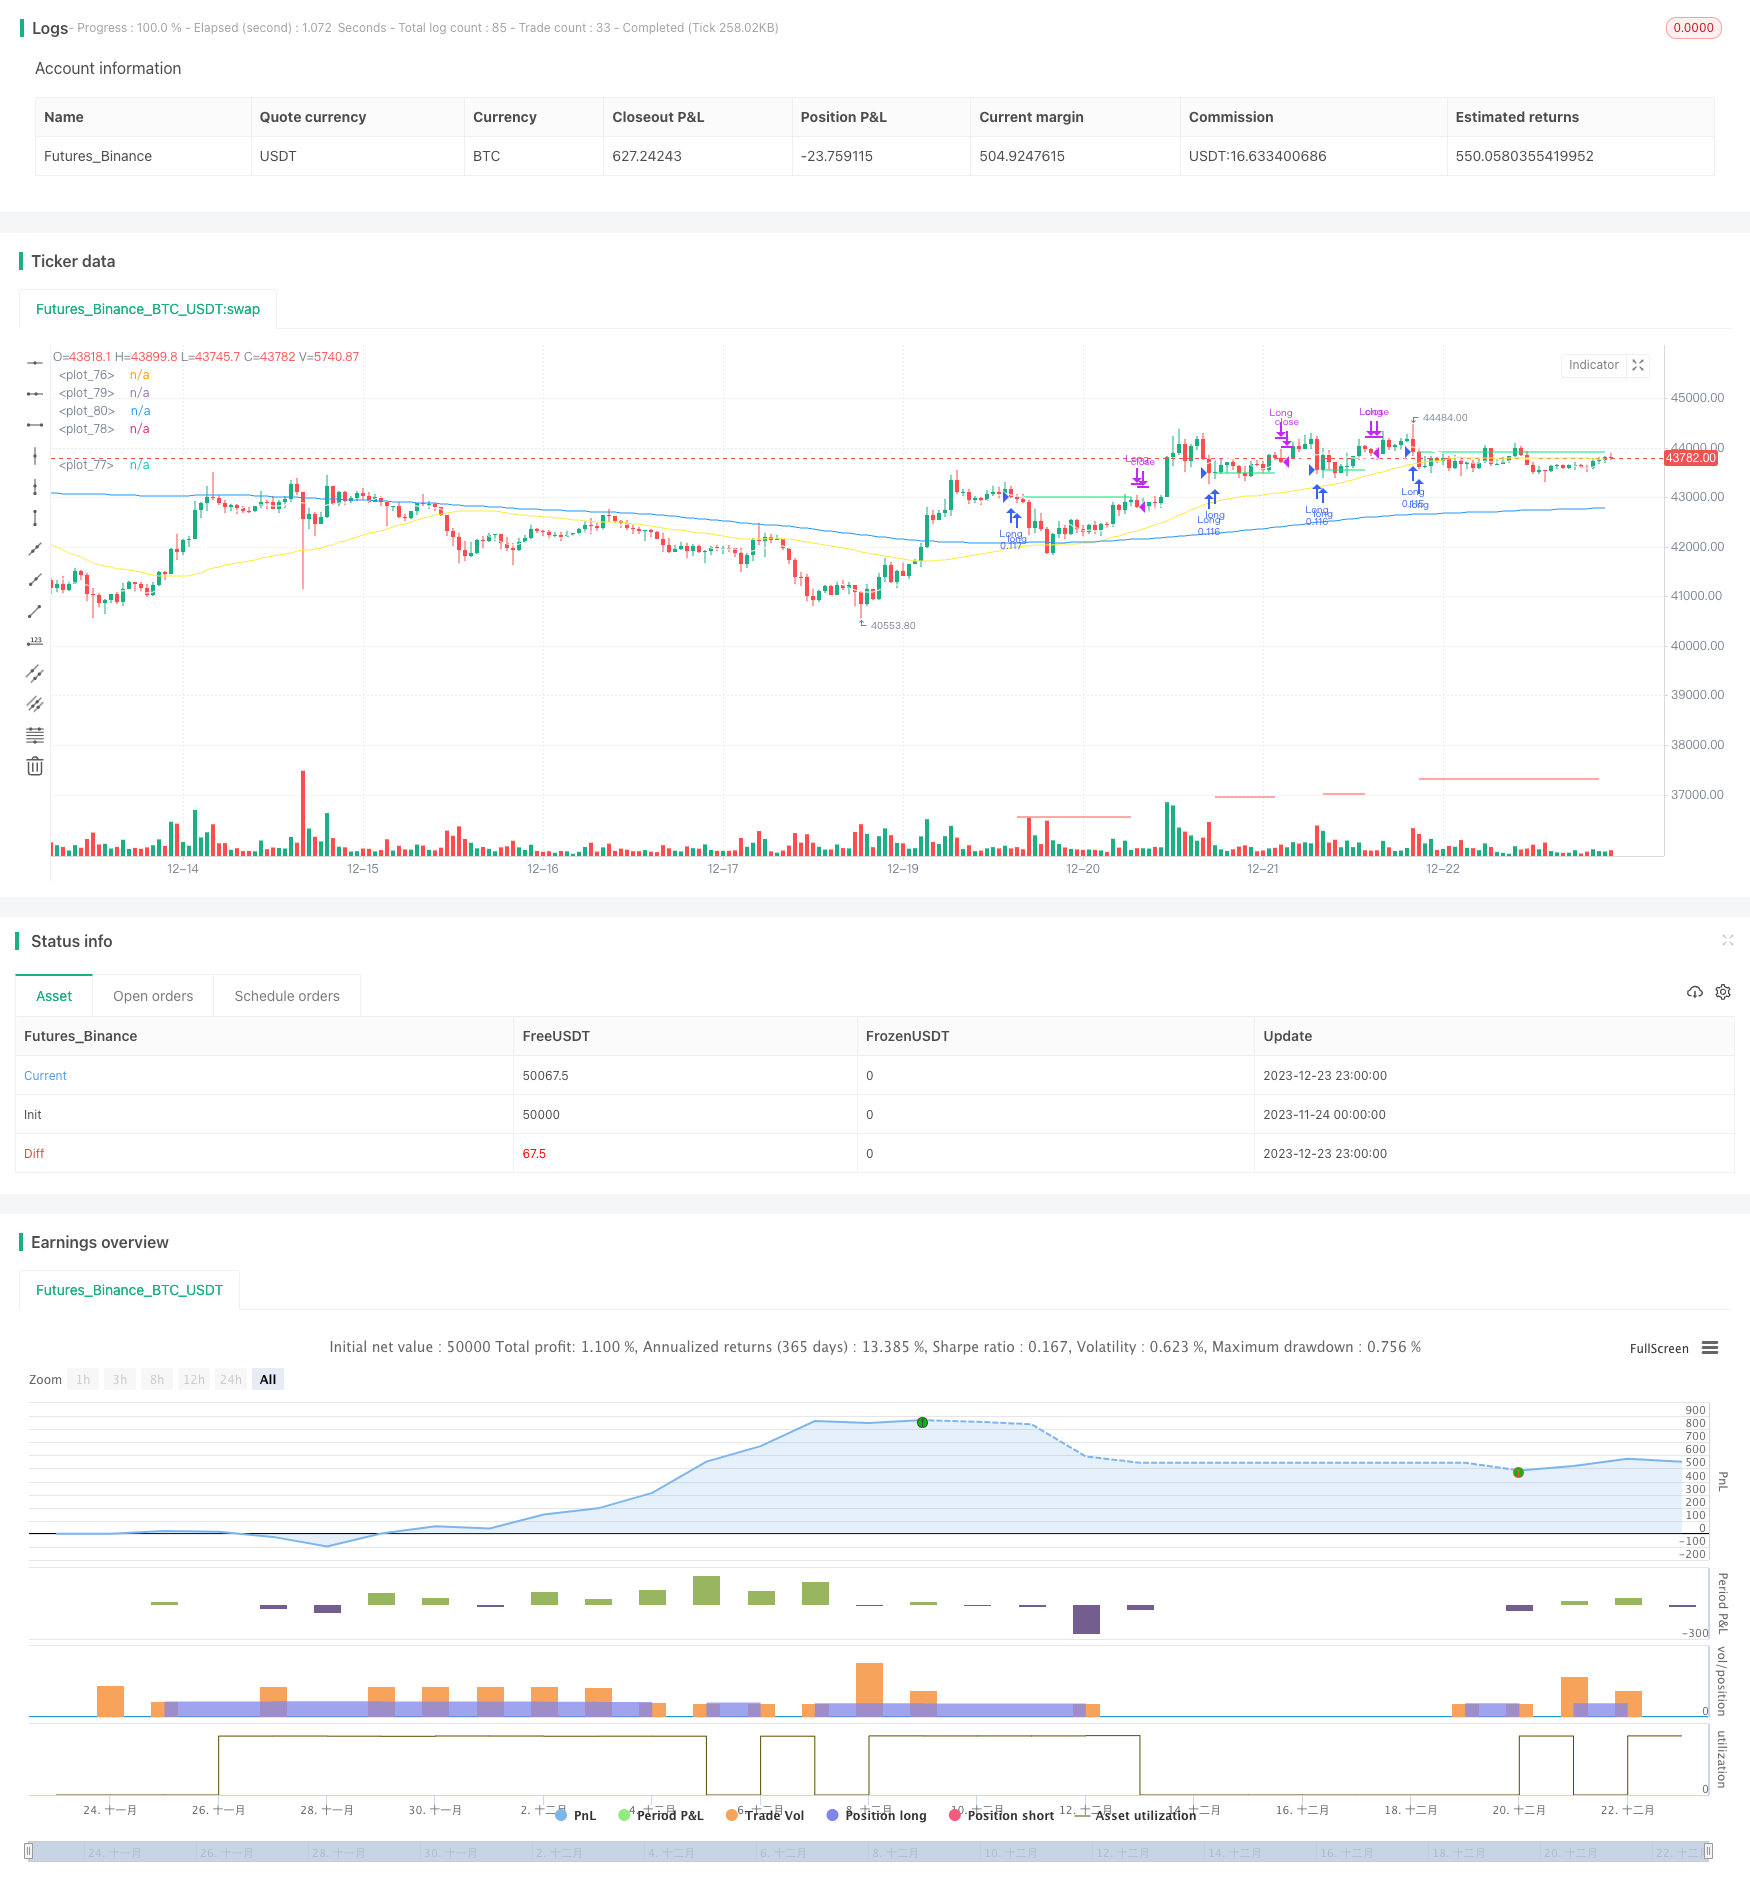
二重移動平均逆転戦略 (Dual Moving Average Reversal Strategy) は,二重移動平均を用いて短期および長期のトレンドを識別する量的な取引戦略である.この戦略は,10日間の簡易移動平均と200日間の簡易移動平均を組み合わせて,長期の負の大きなトレンドの下,短期的な回调買い機会を捕捉する.同時に,この戦略には一定のトレンド追跡と損失制御機構がある.
戦略原則
双動平均の逆転策は主に以下の仮定に基づいています.
200日単調移動平均は,市場の長期トレンドの方向を識別することができる.価格が200日線以上であるとき,大盘は長期の看板傾向にあることを代表する.
10日間のSMAは,市場の短期的な引き下げを識別できる.価格が10日線を下回ったときは,短期間の引き下げを代表する.
長期的に見れば,短期的な反発は,低吸入率で効率的に捕獲できる機会として見られる.
上記の仮定に基づいて,この戦略の取引信号生成の論理は次のとおりです.
閉盤価格が200日線を上越し,同時に10日線を下越すとき,長期のトレンドを代表する看板が,短期の回調が発生し,買い信号が生じます.
ポジションを取っているとき,短期トレンドの逆転を表す閉盘価格が10日線を再び越えた場合,直ちに止損場を出るべきである.また,株価が大幅な下落により損失が事前に設定された止損ラインに達した場合も,主動止損を行う.
大盤全体で大幅な下落が発生したときは,低吸入の機会として,事前に設定された下落の値によって買い時を判断することができる.
このような設計により,牛市が長期的にの大きな傾向にある場合,低吸追を効果的に行い,リスク管理のためにストップを設定することができる.
戦略的優位性
移動平均の逆転策には以下の利点があります.
- 戦略は明確でシンプルで,理解し,実行しやすい.
- 双動平均フィルターを使用すると,大盤と個別の株の長期短期トレンドを効果的に識別できます.
- 時間の効率が良い. 短期的な反転を捉えることで,資金の使用効率が高くなる.
- 組み込みの止損メカニズムで,個々のポジションの損失をうまくコントロールできます.
- フレキシブルなパラメータ設定は,大盤指数と人気の個人株に適用されます.
戦略リスク
双移動平均の逆転策の利点は明らかですが,リスクもあります.
- 大盤が長期の収束状態にあるとき,誤信号が生じやすいので,戦略のパフォーマンスに影響する.このとき,戦略を一時停止し,明確なトレンドが再起動されるのを待つ必要がある.
- 移動平均だけでトレンドを判断し,シグナルを生成することで,他の有効な特性を逃す可能性があります. 組み合わせ最適化のためにより多くの指標を導入することを検討することができます.
- 単一の止損方法が過度に頑固である場合,異なるタイプの止損機構をテストすることができます.
- 策略パラメータは,異なる標準に対して調整・最適化が必要で,そうでなければ安定性に影響する.
戦略最適化の方向性
双動平均の逆転策には,以下の方向で最適化できます.
- 異なる長さの移動平均の組み合わせをテストし,最適なパラメータを探します.
- 他の補助指標を追加して,より安定した信号を形成する.例えば,交差量,震動指標など.
- 追跡停止,時間停止など,さまざまな種類の停止方法をテストする.
- 市場状況の変化に適応できるように,購入と停止のパラメータを最適化します.
- 機械学習アルゴリズムを追加し,より多くの歴史データを使用してパラメータを最適化します.
要約する
双移動平均逆転戦略は,全体として非常に実用的な量化戦略である.それは,移動平均の優位性を利用し,長線多頭情勢で低吸入と損失を停止し,その結果,高い一輪の利益を得る.同時に,それは,ある程度の大盤識別能力とリスク管理をもっている.継続的なテストと最適化によって,この戦略のパフォーマンスは,より優れたものになると信じられている.
/*backtest
start: 2023-11-24 00:00:00
end: 2023-12-24 00:00:00
period: 1h
basePeriod: 15m
exchanges: [{"eid":"Futures_Binance","currency":"BTC_USDT"}]
*/

// This source code is subject to the terms of the Mozilla Public License 2.0 at https://mozilla.org/MPL/2.0/
// © Gold_D_Roger
//note: spreading 1 statement over multiple lines needs 1 apce + 1 tab | multi line function is 1 tab
//Recommended tickers: SPY (D), QQQ (D) and big indexes, AAPL (4H)

//@version=5
strategy("Davin's 10/200MA Pullback on SPY Strategy v2.0",
     overlay=true,
     initial_capital=10000,
     default_qty_type=strategy.percent_of_equity,
     default_qty_value=10, // 10% of equity on each trade
     commission_type=strategy.commission.cash_per_contract,
     commission_value=0.1) //Insert your broker's rate, IB is 0.005USD or tiered

//Best parameters
// SPY D
// Stop loss 0.15
// commission of 0.005 USD using Interactive brokers
// Exit on lower close
// Buy more when x% down --> 14%
// DO NOT include stop condition using MA crossover

// Get User Input
i_ma1           = input.int(title="MA Length 1", defval=200, step=10, group="Strategy Parameters", tooltip="Long-term MA 200")
i_ma2           = input.int(title="MA Length 2", defval=10, step=10, group="Strategy Parameters", tooltip="Short-term MA 10")
i_ma3           = input.int(title="MA Length 3", defval=50, step=1, group="Strategy Parameters", tooltip="MA for crossover signals`")
i_stopPercent   = input.float(title="Stop Loss Percent", defval=0.15, step=0.01, group="Strategy Parameters", tooltip="Hard stop loss of 10%")
i_startTime     = input(title="Start filter", defval=timestamp("01 Jan 2013 13:30 +0000"), group="Time filter", tooltip="Start date and time to begin")
i_endTime       = input(title="End filter", defval=timestamp("01 Jan 2099 19:30 +0000"), group="Time filter", tooltip="End date and time to stop")
i_lowerClose    = input.bool(title="Exit on lower close", defval=true, group="Strategy Parameters", tooltip="Wait for lower close after above 10SMA before exiting") // optimise exit strat, boolean type creates tickbox type inputs
i_contrarianBuyTheDip = input.bool(title="Buy whenever more than x% drawdown", defval=true, group="Strategy Parameters", tooltip="Buy the dip! Whenever x% or more drawdown on SPY")
i_contrarianTrigger = input.int(title="Trigger % drop to buy the dip", defval=14, step=1, group="Strategy Parameters", tooltip="% drop to trigger contrarian Buy the Dip!")
//14% to be best for SPY 1D
//20% best for AMZN 1D
i_stopByCrossover_MA2_3 = input.bool(title="Include stop condition using MA crossover", defval=false, group="Strategy Parameters", tooltip="Sell when crossover of MA2/1 happens")

// Get indicator values
ma1 = ta.sma(close,i_ma1) //param 1
ma2 = ta.sma(close,i_ma2) //param 2
ma3 = ta.sma(close,i_ma3) //param 3
ma_9 = ta.ema(close,9) //param 2
ma_20 = ta.ema(close,20) //param 3

// Check filter(s)
f_dateFilter = true //make sure date entries are within acceptable range

// Highest price of the prev 52 days: https://www.tradingcode.net/tradingview/largest-maximum-value/#:~:text=()%20versus%20ta.-,highest(),max()%20and%20ta.
highest52 = ta.highest(high,52)
overall_change = ((highest52 - close[0]) / highest52) * 100

// Check buy/sell conditions
var float buyPrice = 0 //intialise buyPrice, this will change when we enter a trade ; float = decimal number data type 0.0
buyCondition  = (close > ma1 and close < ma2 and strategy.position_size == 0 and f_dateFilter) or (strategy.position_size == 0 and i_contrarianBuyTheDip==true and overall_change > i_contrarianTrigger and f_dateFilter) // higher than 200sma, lower than short term ma (pullback) + avoid pyramiding positions
sellCondition = close > ma2 and strategy.position_size > 0 and (not i_lowerClose or close < low[1])  //check if we already in trade + close above 10MA;
// third condition: EITHER i_lowerClose not turned on OR closing price has to be < previous candle's LOW [1]

stopDistance  = strategy.position_size > 0 ? ((buyPrice - close)/close) : na // check if in trade > calc % drop dist from entry, if not na
stopPrice     = strategy.position_size > 0 ? (buyPrice - (buyPrice * i_stopPercent)) : na // calc SL price if in trade, if not, na
stopCondition = (strategy.position_size > 0 and stopDistance > i_stopPercent) or (strategy.position_size > 0 and (i_stopByCrossover_MA2_3==true and ma3 < ma1))


// Enter positions
if buyCondition
    strategy.entry(id="Long", direction=strategy.long) //long only


if buyCondition[1] // if buyCondition is true prev candle
    buyPrice := open // entry price = current bar opening price

// Exit position
if sellCondition or stopCondition
    strategy.close(id="Long", comment = "Exit" + (stopCondition ? "Stop loss=true" : "")) // if condition? "Value for true" : "value for false"
    buyPrice := na //reset buyPrice

// Plot
plot(buyPrice, color=color.lime, style=plot.style_linebr)
plot(stopPrice, color=color.red, style=plot.style_linebr, offset = -1)
plot(ma1, color=color.blue) //defval=200
plot(ma2, color=color.white) //defval=10
plot(ma3, color=color.yellow) // defval=50