極値法に基づく統計的ボラティリティバックテスト戦略
作成日:
2023-12-26 10:24:53
最終変更日:
2023-12-26 10:24:53
コピー:
4
クリック数:
831
1
フォロー
1751
フォロワー
概要
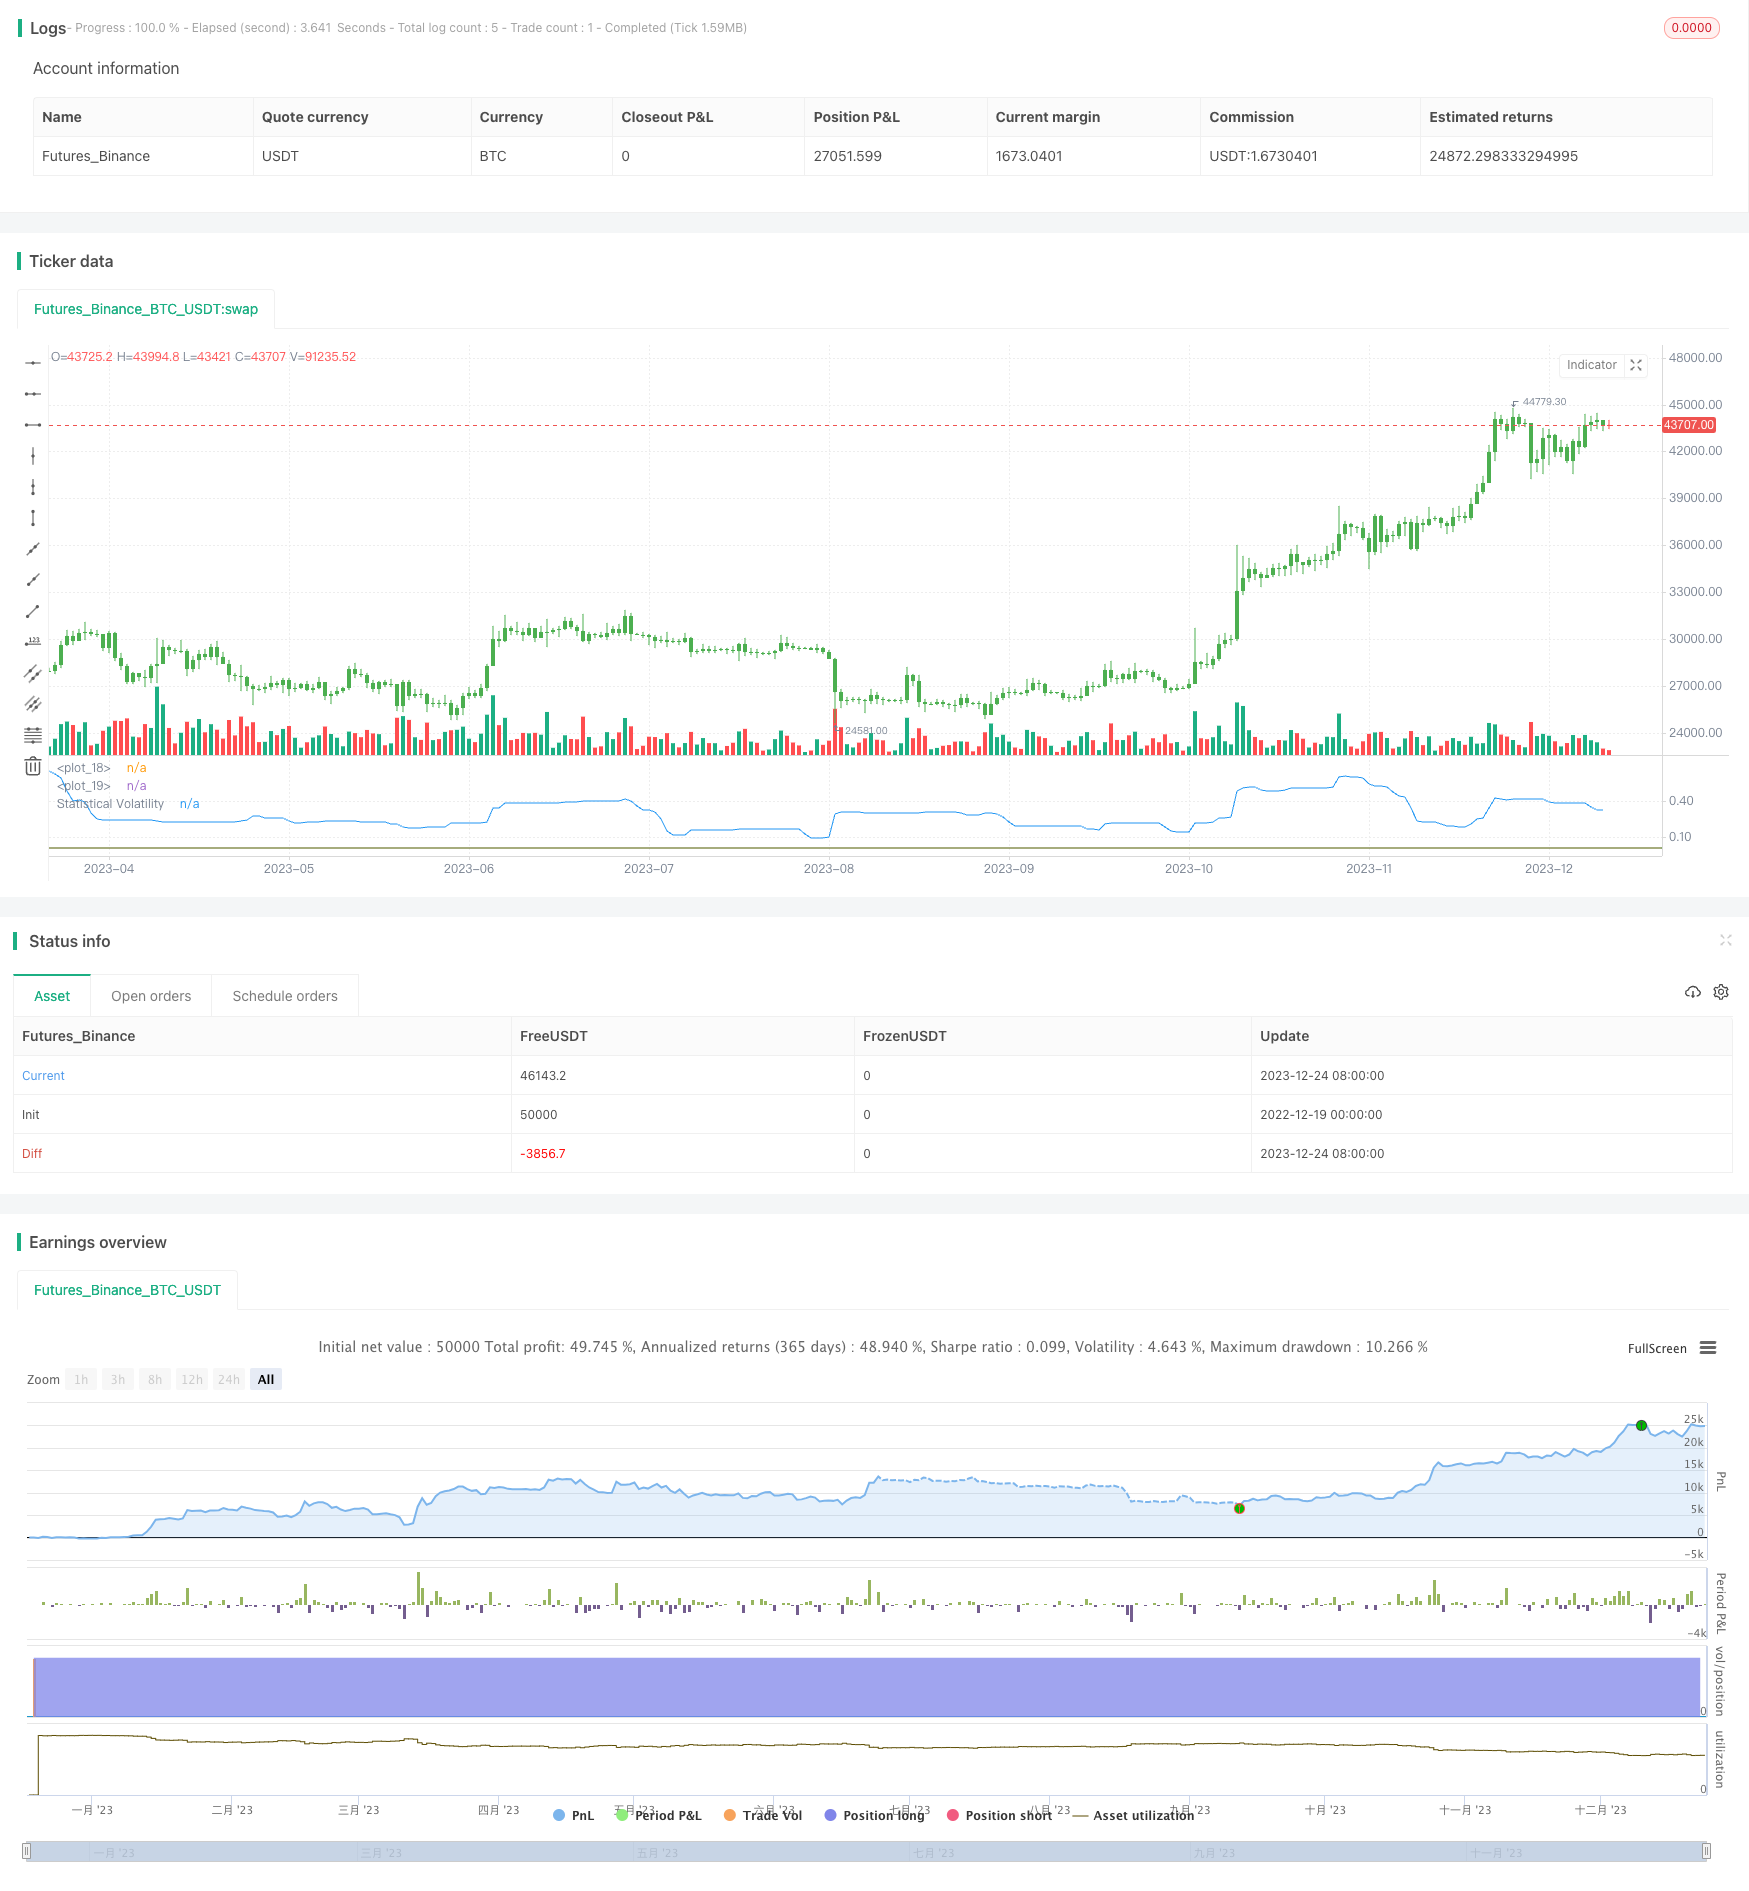
この戦略は,極値法を使用して統計的変動率,または歴史的変動率を計算します. それは,最高価格,最低価格,閉店価格の極値,時間要因を組み合わせて,統計的変動率を計算します. この変動率は,資産価格の変動性を反映します.
戦略原則
一定の時間周期における最高値,最低値,閉店価格の極値を計算する.
極限値法公式を適用して統計変動率を計算する
SqrTime = sqrt(253 / Length)
Vol = ((0.6 * log(xMaxC / xMinC) * SqrTime) + (0.6 * log(xMaxH / xMinL) * SqrTime)) * 0.5
波動率と設定された上下値を比較し,取引シグナルを生成する
pos = iff(nRes > TopBand, 1,
         iff(nRes < LowBand, -1, nz(pos[1], 0)))
取引のシグナルによって,プラスまたはマイナス
優位分析
この戦略の利点は以下の通りです
- 統計的波動性指標を使用し,市場のホットポイントと逆転の機会を効果的に捉える
- 極限値法による変動率計算,極限価格に無感で,結果がより安定し,信頼性がある
- パラメータを調整することで,異なる波動率環境に対応する取引が可能
リスク分析
この戦略には以下のリスクがあります.
- 統計的変動率自体には後退性があり,市場の転換点を正確に把握することができません.
- 波動性指数は突発的な出来事に対して反応が遅いため,短期間の取引機会を逃す可能性があります.
- 特定の取引ミスリスクとストップ・ロースのリスク
対応策と解決策:
- 統計の周期を適切に短縮し,市場の変化に対する感受性を高めること
- 信号の正確性を高めるために,他の指標と組み合わせる
- ストップポイントを設定し,単一損失をコントロールします.
最適化の方向
この戦略の最適化方向は
- 異なる統計周期パラメータをテストし,最適なパラメータを見つけます.
- ポジション管理モジュールを追加し,波動率に応じてポジションを調整します.
- 移動平均などの指標と組み合わせて,フィルタリング条件を設定し,誤った取引を減らす
要約する
この戦略は極値法を使用して統計変動率を計算し,変動率の異動を捕捉して取引信号を生成する.単純移動平均などの指標と比較して,市場の変動性を反映し,反転を捕捉する.同時に,極値法アルゴリズムは結果をより安定して信頼性のあるものにする.パラメータ調整と最適化により,この戦略は異なる市場状況に適応し,取引理念と統計変動率指標はさらなる研究と応用に値する.
ストラテジーソースコード
/*backtest
start: 2022-12-19 00:00:00
end: 2023-12-25 00:00:00
period: 1d
basePeriod: 1h
exchanges: [{"eid":"Futures_Binance","currency":"BTC_USDT"}]
*/

//@version=2
////////////////////////////////////////////////////////////
//  Copyright by HPotter v1.0 22/11/2014
// This indicator used to calculate the statistical volatility, sometime
// called historical volatility, based on the Extreme Value Method.
// Please use this link to get more information about Volatility.
//
// You can change long to short in the Input Settings
// WARNING:
// - For purpose educate only
// - This script to change bars colors.
////////////////////////////////////////////////////////////
strategy(title="Statistical Volatility - Extreme Value Method ", shorttitle="Statistical Volatility Backtest")
Length = input(30, minval=1)
TopBand = input(0.005, step=0.001)
LowBand = input(0.0016, step=0.001)
reverse = input(false, title="Trade reverse")
hline(TopBand, color=red, linestyle=line)
hline(LowBand, color=green, linestyle=line)
xMaxC = highest(close, Length)
xMaxH = highest(high, Length)
xMinC = lowest(close, Length)
xMinL = lowest(low, Length)
SqrTime = sqrt(253 / Length)
Vol = ((0.6 * log(xMaxC / xMinC) * SqrTime) + (0.6 * log(xMaxH / xMinL) * SqrTime)) * 0.5
nRes = iff(Vol < 0,  0, iff(Vol > 2.99, 2.99, Vol))
pos = iff(nRes > TopBand, 1,
	   iff(nRes < LowBand, -1, nz(pos[1], 0)))
possig = iff(reverse and pos == 1, -1,
          iff(reverse and pos == -1, 1, pos))
if (possig == 1)
    strategy.entry("Long", strategy.long)
if (possig == -1)
    strategy.entry("Short", strategy.short)
barcolor(possig == -1 ? red: possig == 1 ? green : blue )
plot(nRes, color=blue, title="Statistical Volatility")