Kライン終値ロングショート比較とEMAフィルタリングに基づく定量取引戦略
戦略概要
この策略は,K線の閉盘価格多空をEMAフィルターと比較した量化取引策略である.この策略は,K線の閉盘価格が最近の一定の周期で構成した多頭K線と空頭K線の数を統計化して,EMAのフィルターと組み合わせて,取引時間帯に合致した場合には多空信号を判断する.
2. 戦略の原則
この戦略の核心的な論理は,統計的に最近のlookback周期で出現した上値のクローズオフのK線数upCloseCountと下値のクローズオフのK線数downCloseCountを計算し,上値のクローズオフの数が多くなったら多頭市場と判断し,下値のクローズオフの数が多くなったら空頭市場と判断する.同時に,EMA指標と組み合わせて価格の傾向を判断し,フィルターとして,価格がEMAより高くなった場合にのみ多頭を考慮し,価格がEMAより低い場合に空頭を考慮する.さらに,戦略は,取引時間段1sessionとsession2を設定し,この2つの時間段にのみ取引する.
具体的にはこうです
多頭シグナルのトリガー条件:inSessionはtrue (取引期間中に) でupCloseCount > downCloseCount (K線が多く上昇して閉店する) でclose > ema (閉店価格がEMAより高い) でcurrentSignalは”long”ではない (現在のポジションなし)
空頭シグナルのトリガー条件:inSessionがtrueでdownCloseCount > upCloseCount ((下落のクローズアップK線数が多い) でclose < ema ((クローズアップ価格がEMAより低い) でcurrentSignalが”ショート”でない ((現在の無所持))
3つ目 戦略的優位性分析
- 統計的に一定の歴史的周期におけるK線閉盤価格の多空比較によって価格傾向と市場心理を判断し,一定の傾向フォロー効果を持つ
- EMA指標と組み合わせた価格トレンドをフィルタリングし,波動的な状況で誤った取引を避ける
- 特定の取引時間帯を設定し,非主要取引時間帯の雑音な状況で取引を避ける
- トレンドと頻度のバランス
4 戦略的リスク分析
- 横軸整理の状況では,閉盤価格の空白比が誤導されやすく,不必要な損失を招きます.
- EMAパラメータの設定が不適切である場合,フィルター効果が悪くなる.
- 取引時間帯を正しく設定しない場合,多くの取引機会が失われ,誤った取引が起こる.
- ギャップの動きを効果的に追跡できませんでした.
対策として
- EMAパラメータを最適化して,最適なバランスを探す
- 取引時間を最適化します.
- ストップ・ストラトジーと組み合わせた単一損失の制御
5 戦略の最適化方向
- 取引時間を最適化して最適な取引時間を特定します.
- EMA周期と滑り方のパラメータ最適化
- ATRベースの止損メカニズムを追加
- ギャップの危険を回避するために,突発事件の認識モジュールを追加
- 他の指標との組み合わせを考慮し,より良いフィルタリングの条件を探します.
- 異なる品種のパフォーマンスの違いをテストし,その違いに応じてパラメータを調整する
VI. 結論
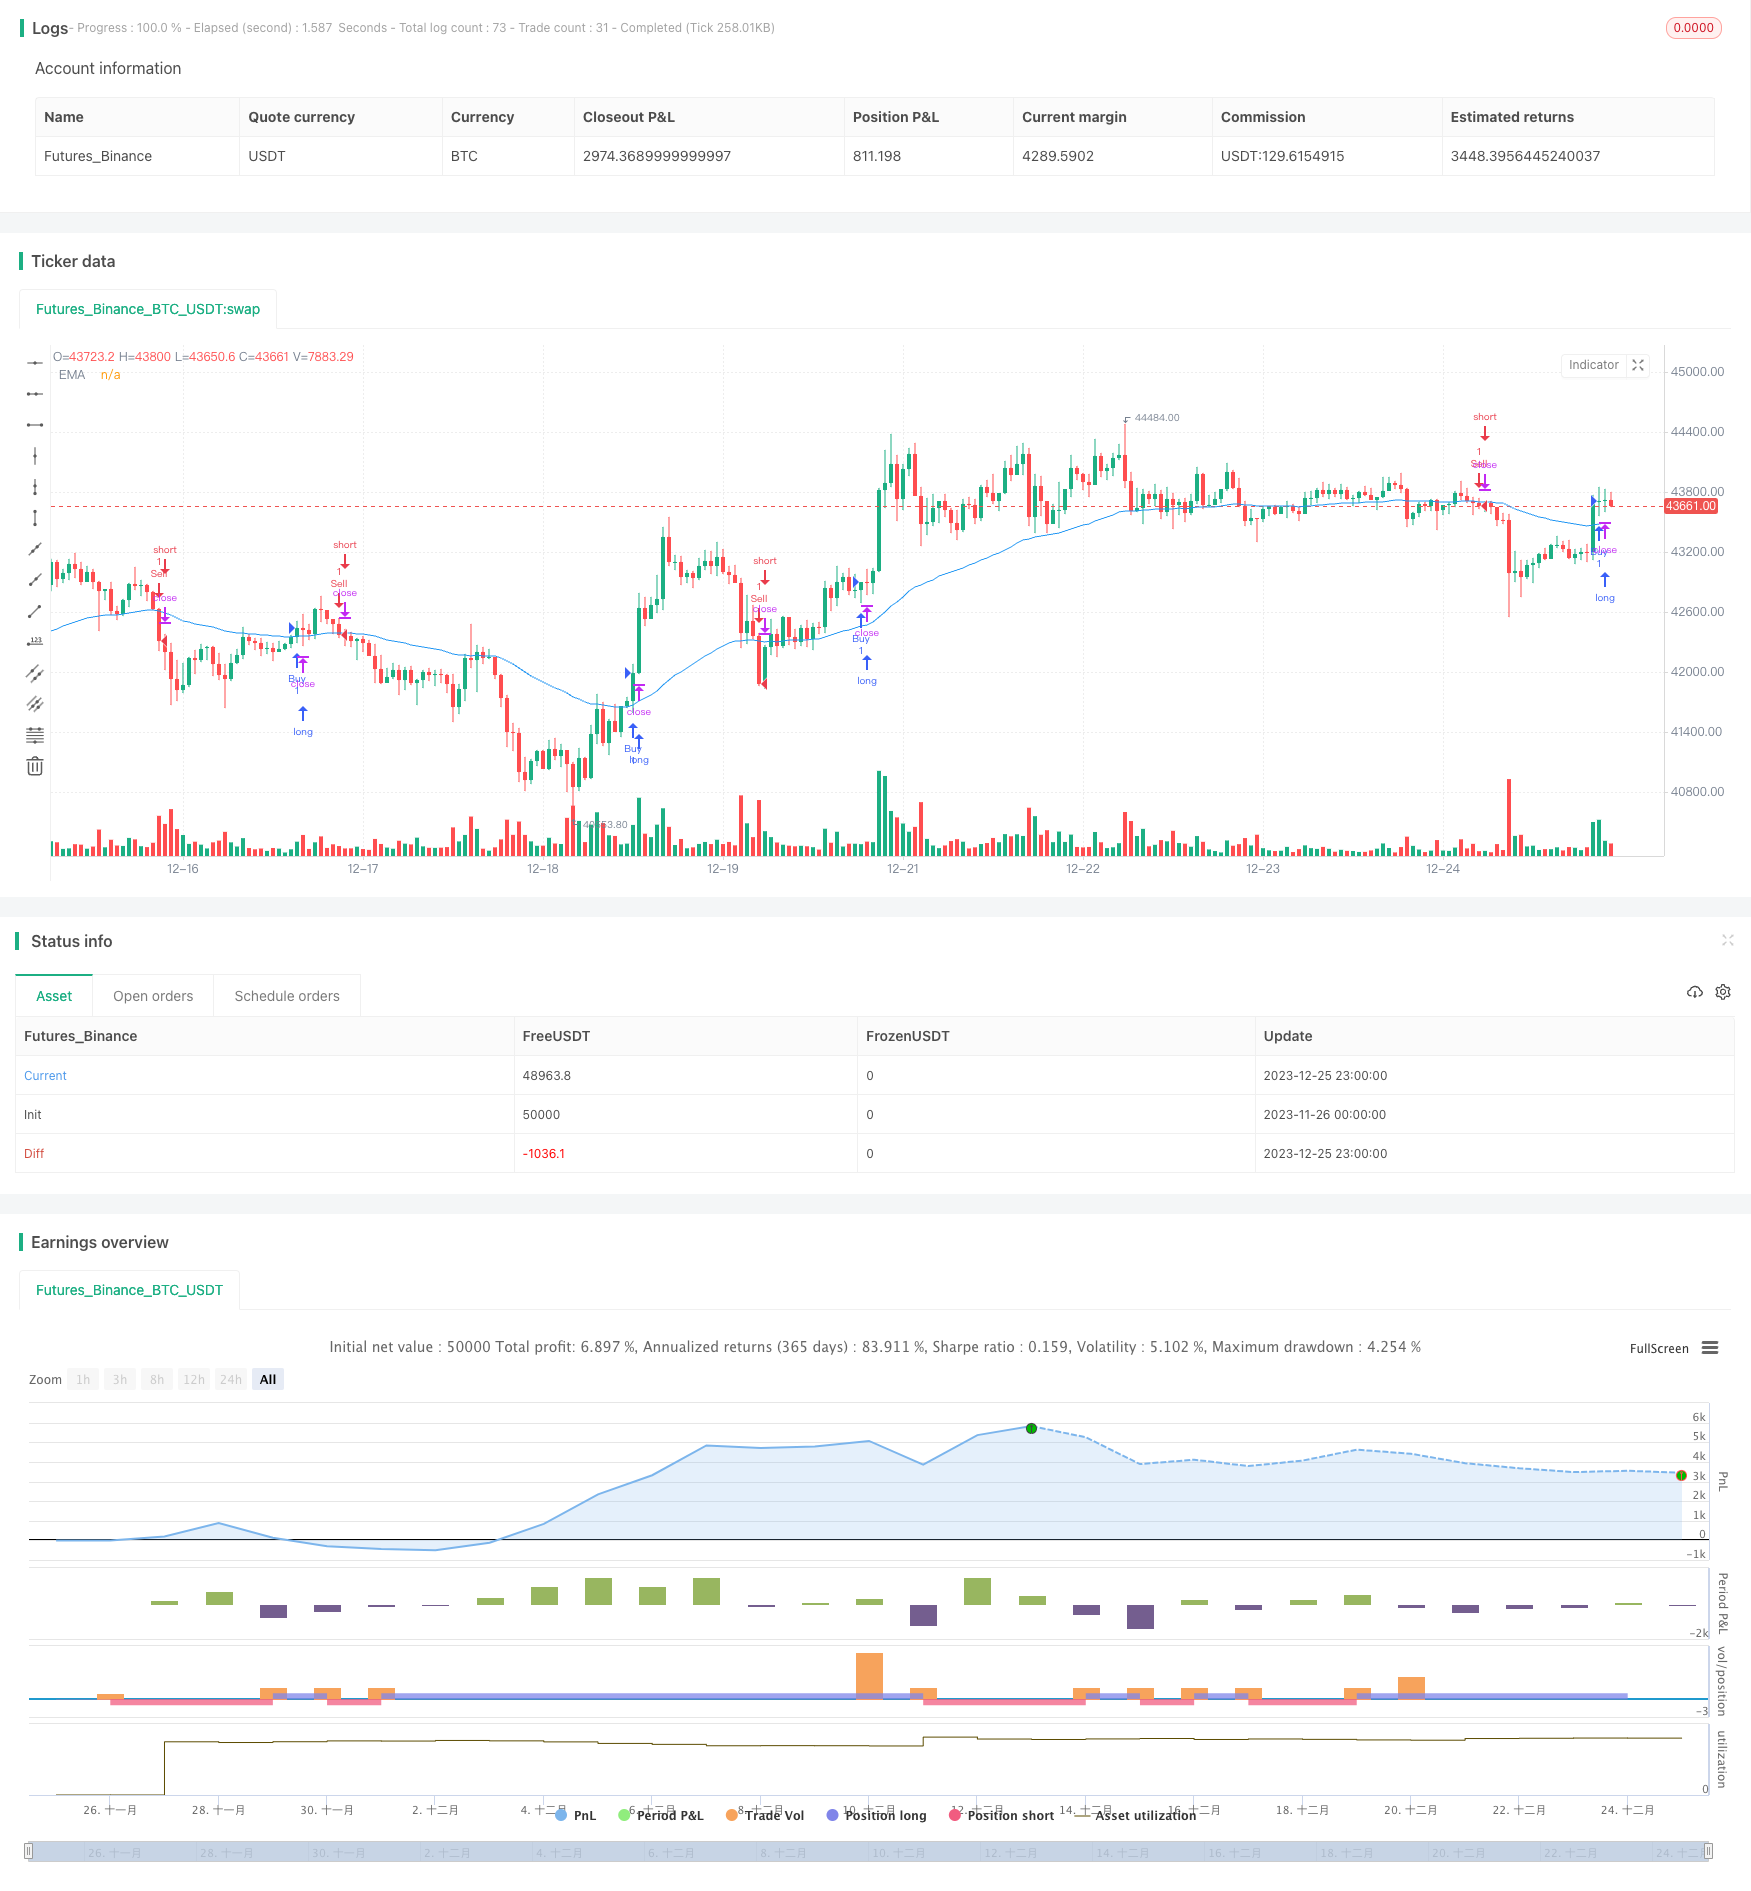
この戦略は,一定の歴史周期でK線閉盘価格を構成した多頭と空頭K線の数を統計的に計算し,EMA指標のフィルタリング効果と組み合わせて,設定された特定の取引時間帯でトレンドシグナルを識別する.一定のトレンド追跡効果がある.しかし,一定の誤取引リスクもある.パラメータ最適化,ストップ・ロース戦略,フィルタリングシグナルなどの方法によって改善し,反測で効果を検証する必要がある.
/*backtest
start: 2023-11-26 00:00:00
end: 2023-12-26 00:00:00
period: 1h
basePeriod: 15m
exchanges: [{"eid":"Futures_Binance","currency":"BTC_USDT"}]
*/

//@version=5
strategy("Up vs Down Close Candles Strategy with EMA and Session Time Frames", shorttitle="UvD Strat EMA Session", overlay=true)

// User input to define the lookback period, EMA period, and session strings for time frames
int lookback = input(20, title="Lookback Period")
int emaPeriod = input(50, title="EMA Period")
string session1 = input("0900-1200", title="Time Frame 1 Session")
string session2 = input("1300-1600", title="Time Frame 2 Session")

// Calculate the EMA
float ema = ta.ema(close, emaPeriod)

// State variable to track the current signal
var string currentSignal = na

// Counting up-close and down-close candles within the lookback period
int upCloseCount = 0
int downCloseCount = 0

if barstate.isnew
    upCloseCount := 0
    downCloseCount := 0
    for i = 0 to lookback - 1
        if close[i] > close[i + 1]
            upCloseCount += 1
        else if close[i] < close[i + 1]
            downCloseCount += 1

// Define the long (buy) and short (sell) conditions with EMA filter and session time frame
bool inSession = time(timeframe.period, session1) or time(timeframe.period, session2)
bool longCondition = inSession and upCloseCount > downCloseCount and close > ema and currentSignal != "long"
bool shortCondition = inSession and downCloseCount > upCloseCount and close < ema and currentSignal != "short"

// Enter or exit the market based on conditions
if longCondition
    currentSignal := "long"
    strategy.entry("Buy", strategy.long)

if shortCondition
    currentSignal := "short"
    strategy.entry("Sell", strategy.short)

// Exit logic for long and short positions
if currentSignal == "long" and strategy.position_size <= 0
    strategy.close("Sell")

if currentSignal == "short" and strategy.position_size >= 0
    strategy.close("Buy")

plot(ema, color=color.blue, title="EMA")