二重移動平均トレーリングストップロス戦略
概要
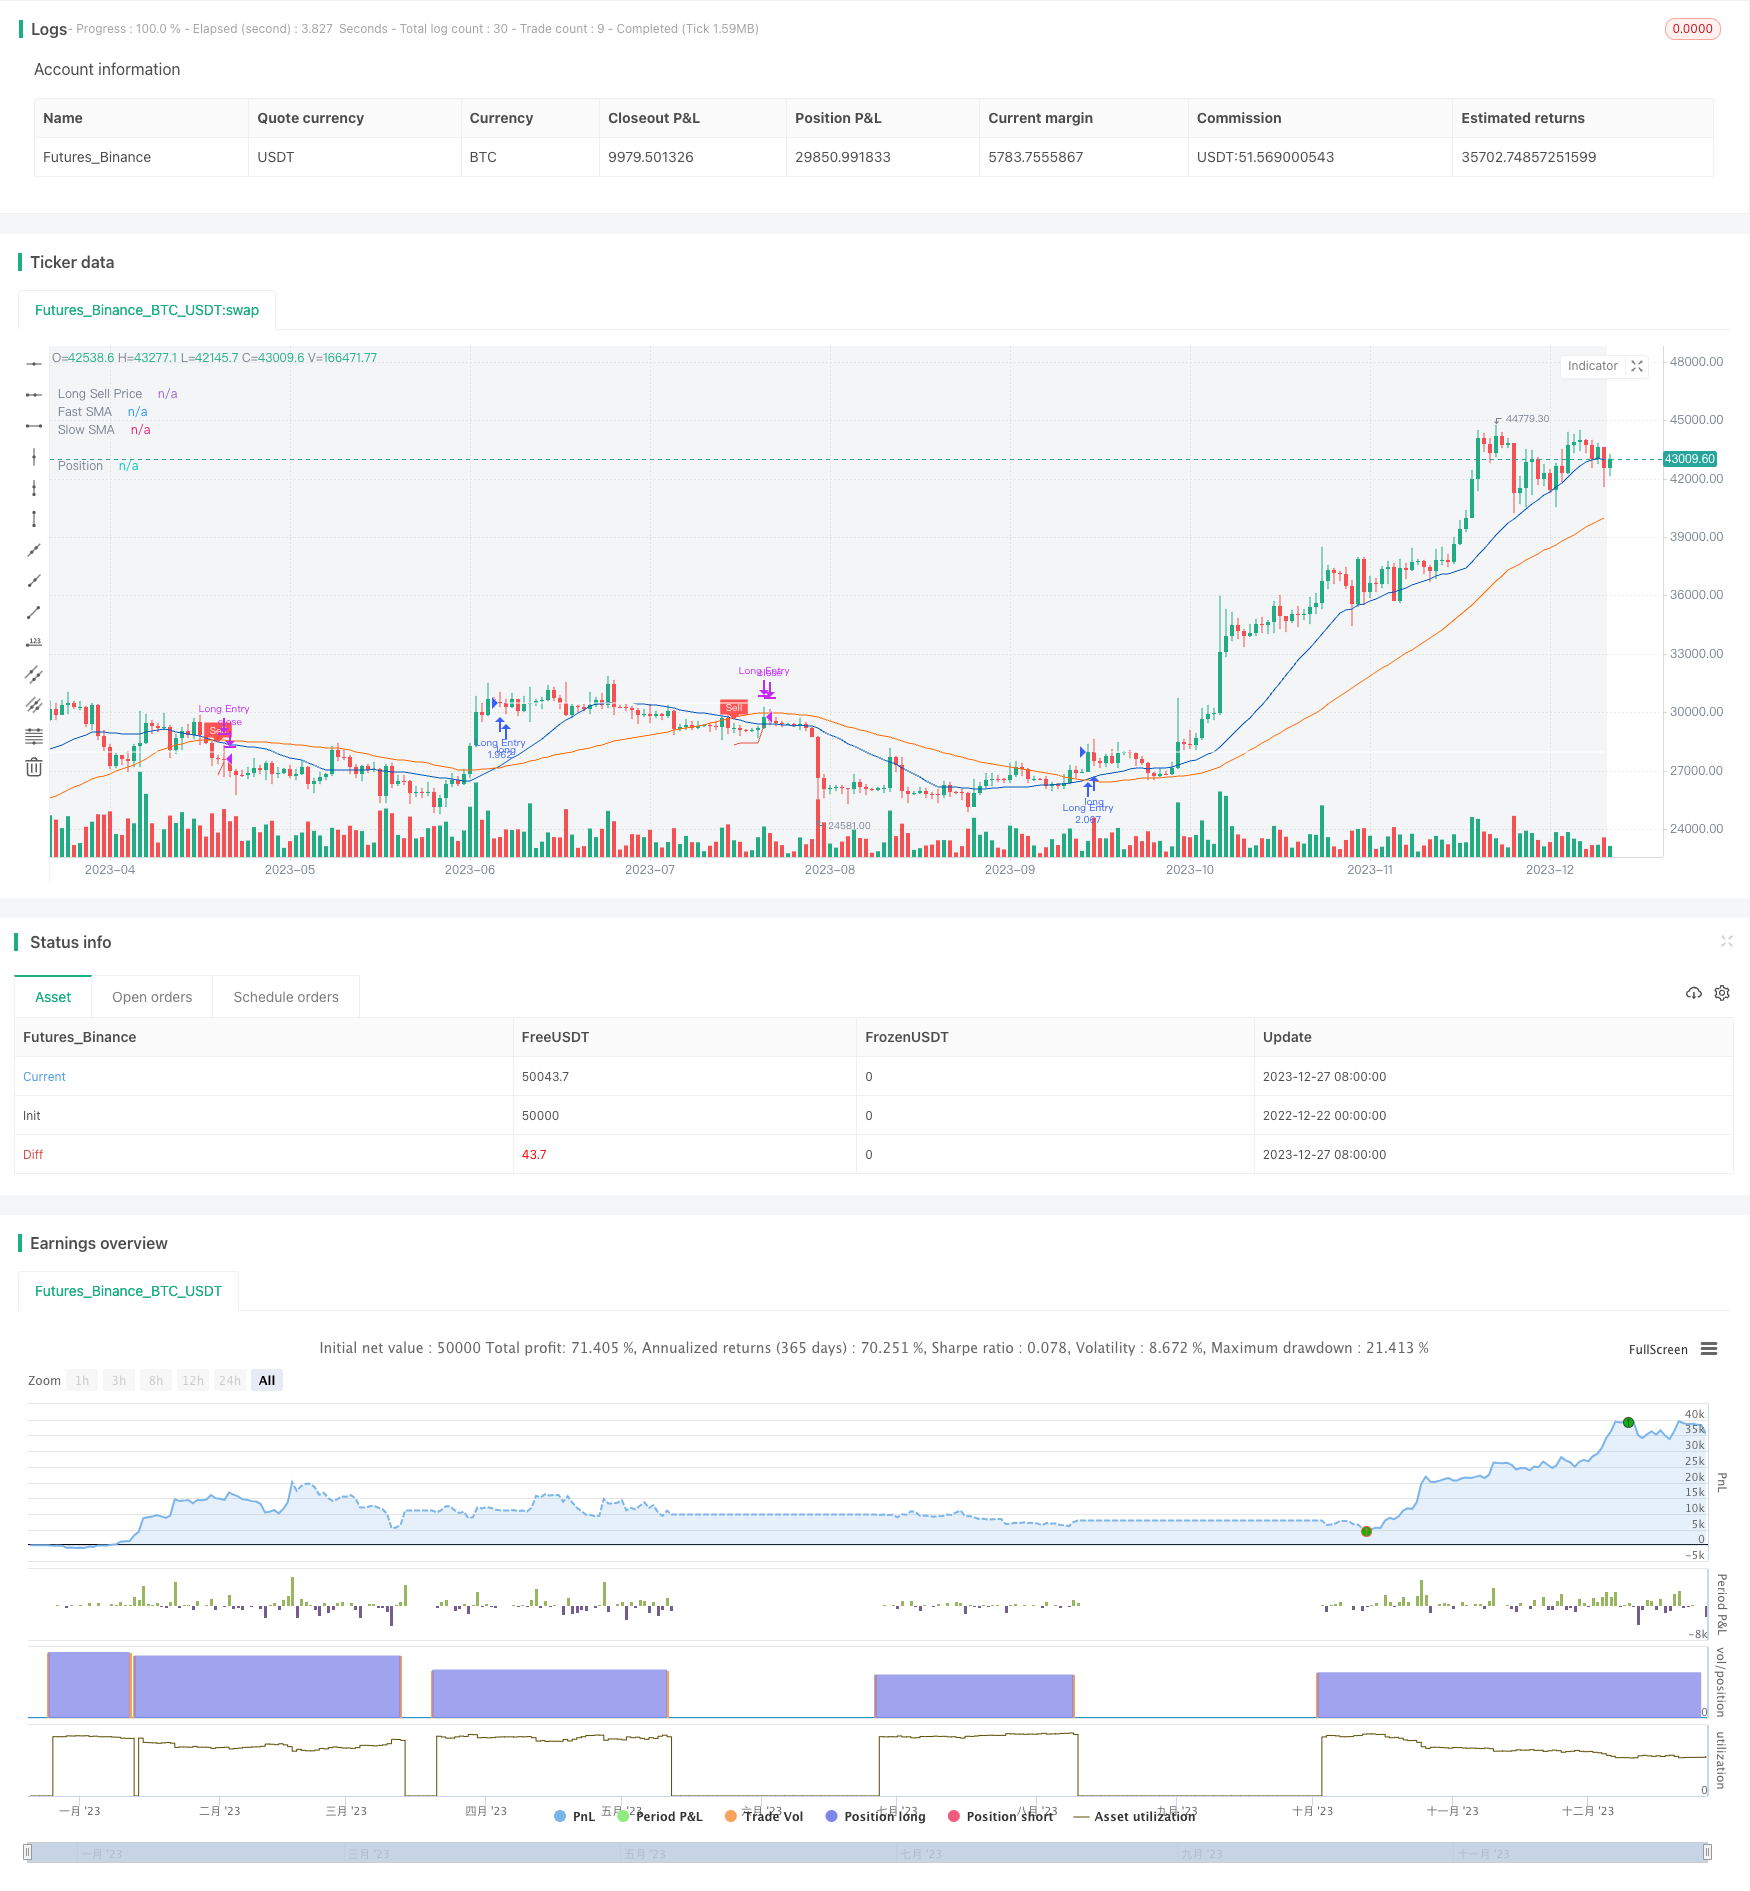
この戦略は,高速平均線と遅い平均線の交差を基に,多空を決定する.高速平均線上での遅い平均線を横切るときに多空を決定し,高速平均線下での遅い平均線を横切るときに平仓する.より高い利益を追求するために,この戦略は,追跡ストップ・ロスの仕組みを採用する.多空をすると,直接取引価格の下のストップ・ロスを設定するのではなく,取引価格の下のストップ・ロスの設定を行う.この追跡ストップ・ロスは,価格が上昇するにつれて上を移動し,価格の下落が損失の止まりを触発する価格の下まで移動する.
戦略原則
この戦略は,速いSMA ((SMA) と遅いSMAを使用して,何と平穏なポジションをするかを決定する. 速いSMA上で遅いSMAを穿越すると,トレンドが上昇すると判断し,その時点で多めにします. 速いSMAの下では遅いSMAを穿越すると,トレンドが逆転すると判断し,平穏なポジションを準備します.
より高い利益を追求するために,この戦略は,追跡ストップ・メカニズムを導入した.多額の取引をすると,固定価格でストップ・オーダーを設定するのではなく,追跡ストップ・価格を設定し,価格上昇とともに上方へと追跡し,価格が一定比率上昇したたびに,追跡ストップ・価格は一定幅の向上調整を行う.価格が逆転し,追跡ストップ・価格に触れたとき,ストップ・オーダーをトリガーし,ポジションを平準化する.
具体的には,ストップ・プライスを追跡する計算式は次のとおりです.
ストップ・トラッキング価格 = 価格 × (1 - ストップ・トラッキングパーセント)
その中,ストップ・トラッキングのパーセントは,戦略パラメータ Deviation % によって設定されます.戦略は,ポジション開設後,Kラインの終了時に新しいトラッキング・ストップ・価格を計算します.新しいトラッキング・ストップ・価格は,上記のKラインのトラッキング・ストップ・価格より低い値にはなりません.
価格が下がり,追跡ストップ・ローに触れたとき,平仓シグナルが誘発され,ポジションは市場価格単位の平仓を使用する.
戦略的優位性
- 双均線を用いてトレンドの方向を判断し,反測効果がよりよい.
- ストップ・ロスを採用することで,より高い利益を追求できます.
- カスタマイズ可能な平均線周期と止損追跡幅
- ストップ・ローンは上昇傾向にあるとき,上昇を続け,利益のほとんどを確保します.
- トレンドが逆転したときに,より大きな損失を回避するために,迅速に止まります.
リスクと解決策
- 均線交差のタイミングを誤って選択すると,仮想信号が発生する可能性がある.異なるパラメータをテストして,最適な均線組み合わせを見つけることができる.
- 追跡ストップが激進すぎると,ストップが早めに破られることがあります. 追跡ストップのパーセンテージパラメータを適切に調整できます.
- 価格が空飛ぶ隙間が発生すると,ストップ・ローを直接打ち破ることもあります.他の指標の組み合わせでトレンドを判断し,波動的な状況で取引を避けるようにお勧めします.
最適化の方向
- 異なる均線周期パラメータをテストして,最適なパラメータの組み合わせを見つけることができます.
- 異なるストップトラッキングパーセンテージをテストして,最適なストップレベルを見つけることができます.
- 他の指標の判断に加えられ,震災時の取引を一時停止し,突発的な出来事の影響を受けないようにする.
要約する
この戦略は,均線指標を総合的に利用してトレンドの方向性を判断し,また,ストップ・ロース・メカニズムを追跡して利益をロックし,トレーニングデータでよく表れている.パラメータの組み合わせを最適化して,リスクを制御することで,安定した収益を期待できる.しかし,いかなる戦略も完全に損失を回避することは不可能である.適切なポジション管理を調整し,異なる品種をテストし,リスクを分散することを推奨する.
/*backtest
start: 2022-12-22 00:00:00
end: 2023-12-28 00:00:00
period: 1d
basePeriod: 1h
exchanges: [{"eid":"Futures_Binance","currency":"BTC_USDT"}]
*/

//@version=5
//
// ▒▒▒▒▒▒▒▒▒▒▒▒▒▒▒▒▒▒▒▒▒▒▒▒▒▒▒▒▒▒▒▒▒▒▒▒▒▒▒▒▒▒▒▒▒▒▒▒▒▒▒▒▒▒▒▒▒▒▒▒▒▒▒▒▒▒▒▒▒▒▒▒▒▒▒▒▒▒▒▒▒▒▒▒▒▒▒▒▒▒▒▒▒▒▒▒▒▒▒▒▒▒▒▒▒▒▒▒▒▒▒▒▒▒
//  -----------------------------------------------------------------------------
//  Copyright 2022 Iason Nikolas | jason5480
//  Trailing Buy script may be freely distributed under the MIT license.
//
//  Permission is hereby granted, free of charge,
//  to any person obtaining a copy of this software and associated documentation files (the "Software"),
//  to deal in the Software without restriction, including without limitation the rights to use, copy, modify, merge,
//  publish, distribute, sublicense, and/or sell copies of the Software, and to permit persons to whom the Software is furnished to do so,
//  subject to the following conditions:
//
//  The above copyright notice and this permission notice shall be included in all copies or substantial portions of the Software.
//
//  THE SOFTWARE IS PROVIDED "AS IS", WITHOUT WARRANTY OF ANY KIND,
//  EXPRESS OR IMPLIED, INCLUDING BUT NOT LIMITED TO THE WARRANTIES OF MERCHANTABILITY,
//  FITNESS FOR A PARTICULAR PURPOSE AND NONINFRINGEMENT. IN NO EVENT SHALL THE AUTHORS OR COPYRIGHT HOLDERS BE LIABLE FOR ANY CLAIM,
//  DAMAGES OR OTHER LIABILITY, WHETHER IN AN ACTION OF CONTRACT, TORT OR OTHERWISE, ARISING FROM,
//  OUT OF OR IN CONNECTION WITH THE SOFTWARE OR THE USE OR OTHER DEALINGS IN THE SOFTWARE.
//
//  -----------------------------------------------------------------------------
//
//  Authors:  @jason5480
//  Revision: v1.0.1
//  Date:     24-Feb-2022
//
//  Description
//  =============================================================================
//  This strategy will go long if fast MA crosses over slow MA.
//  If the 'Enable Trailing` is checked then the strategy instead of exiting from the position
//  directly it will follow the price upwards (percentagewise) with small steps
//  If the price drops by this percentage then the exit order will be executed
//
//  The strategy has the following parameters:
//
//  Fast SMA Length - How many candles back to calculte the fast SMA.
//  Slow SMA Length - How many candles back to calculte the slow SMA.
//  Enable Trailing - Enable or disable the trailing
//  Deviation % - The step to follow the price when the open position condition is met.
//  Source Exit Control - The source price to compare with the exit price to trigger the exit order when trailing.
//
//  -----------------------------------------------------------------------------
//  Disclaimer:
//    1. I am not licensed financial advisors or broker dealer. I do not tell you
//       when or what to buy or sell. I developed this software which enables you
//       execute manual or automated using TradingView. The
//       software allows you to set the criteria you want for entering and exiting
//       trades.
//    2. Do not trade with money you cannot afford to lose.
//    3. I do not guarantee consistent profits or that anyone can make money with no
//       effort. And I am not selling the holy grail.
//    4. Every system can have winning and losing streaks.
//    5. Money management plays a large role in the results of your trading. For
//       example: lot size, account size, broker leverage, and broker margin call
//       rules all have an effect on results. Also, your Take Profit and Stop Loss
//       settings for individual pair trades and for overall account equity have a
//       major impact on results. If you are new to trading and do not understand
//       these items, then I recommend you seek education materials to further your
//       knowledge.
//
//    YOU NEED TO FIND AND USE THE TRADING SYSTEM THAT WORKS BEST FOR YOU AND YOUR
//    TRADING TOLERANCE.
//
//    I HAVE PROVIDED NOTHING MORE THAN A TOOL WITH OPTIONS FOR YOU TO TRADE WITH THIS PROGRAM ON TRADINGVIEW.
//
//    I accept suggestions to improve the script.
//    If you encounter any problems I will be happy to share with me.
//  -----------------------------------------------------------------------------
//
// ▒▒▒▒▒▒▒▒▒▒▒▒▒▒▒▒▒▒▒▒▒▒▒▒▒▒▒▒▒▒▒▒▒▒▒▒▒▒▒▒▒▒▒▒▒▒▒▒▒▒▒▒▒▒▒▒▒▒▒▒▒▒▒▒▒▒▒▒▒▒▒▒▒▒▒▒▒▒▒▒▒▒▒▒▒▒▒▒▒▒▒▒▒▒▒▒▒▒▒▒▒▒▒▒▒▒▒▒▒▒▒▒▒▒
// SETUP ============================================================================================================

strategy(title = 'Trailing Sell',
         shorttitle = 'TS',
         overlay = true,
         pyramiding = 0,
         default_qty_type = strategy.percent_of_equity,
         default_qty_value = 100,
         initial_capital = 100000)

//
// ▒▒▒▒▒▒▒▒▒▒▒▒▒▒▒▒▒▒▒▒▒▒▒▒▒▒▒▒▒▒▒▒▒▒▒▒▒▒▒▒▒▒▒▒▒▒▒▒▒▒▒▒▒▒▒▒▒▒▒▒▒▒▒▒▒▒▒▒▒▒▒▒▒▒▒▒▒▒▒▒▒▒▒▒▒▒▒▒▒▒▒▒▒▒▒▒▒▒▒▒▒▒▒▒▒▒▒▒▒▒▒▒▒▒
// FILTERS ==========================================================================================================

// INPUT ============================================================================================================
usefromDate = input.bool(defval = true, title = 'From', inline = "From Date", group = "Filters")
fromDate = input(defval = timestamp('01 Jan 2021 00:00 UTC'), title = '', inline = "From Date", group = 'Filters')
usetoDate = input.bool(defval = false, title = 'To ', inline = "To Date", group = "Filters")
toDate = input(defval = timestamp('31 Dec 2121 23:59 UTC'), title = '', inline = "To Date", group = 'Filters')

// LOGIC ============================================================================================================
isWithinPeriod() => true // create function "within window of time"

// PLOT =============================================================================================================
bgcolor(color = isWithinPeriod() ? color.new(color.gray, 90) : na, title = 'Period')

//
// ▒▒▒▒▒▒▒▒▒▒▒▒▒▒▒▒▒▒▒▒▒▒▒▒▒▒▒▒▒▒▒▒▒▒▒▒▒▒▒▒▒▒▒▒▒▒▒▒▒▒▒▒▒▒▒▒▒▒▒▒▒▒▒▒▒▒▒▒▒▒▒▒▒▒▒▒▒▒▒▒▒▒▒▒▒▒▒▒▒▒▒▒▒▒▒▒▒▒▒▒▒▒▒▒▒▒▒▒▒▒▒▒▒▒
// STRATEGY =========================================================================================================

// INPUT ============================================================================================================
fastMALen = input.int(defval = 21, title = 'Fast/Slow SMA Length', inline = 'MA Length', group = 'Strategy')
slowMALen = input.int(defval = 49, title = '', tooltip = 'How many candles back to calculte the fast/slow SMA.', inline = 'MA Length', group = 'Strategy')

// LOGIC ============================================================================================================
fastMA = ta.sma(close, fastMALen)
slowMA = ta.sma(close, slowMALen)

bool openLongPosition = isWithinPeriod() and ta.crossover(fastMA, slowMA)
bool closeLongPosition = ta.crossunder(fastMA, slowMA)

// PLOT =============================================================================================================
var fastColor = color.new(#0056BD, 0)
plot(series = fastMA, title = 'Fast SMA', color = fastColor, linewidth = 1, style = plot.style_line)
var slowColor = color.new(#FF6A00, 0)
plot(series = slowMA, title = 'Slow SMA', color = slowColor, linewidth = 1, style = plot.style_line)

plotshape(series = closeLongPosition and strategy.position_size > 0 ? fastMA : na, title = 'Sell', text = 'Sell', style = shape.labeldown, location = location.absolute, color = color.new(color.red, 0), textcolor = color.new(color.white, 0), size = size.tiny)

//
// ▒▒▒▒▒▒▒▒▒▒▒▒▒▒▒▒▒▒▒▒▒▒▒▒▒▒▒▒▒▒▒▒▒▒▒▒▒▒▒▒▒▒▒▒▒▒▒▒▒▒▒▒▒▒▒▒▒▒▒▒▒▒▒▒▒▒▒▒▒▒▒▒▒▒▒▒▒▒▒▒▒▒▒▒▒▒▒▒▒▒▒▒▒▒▒▒▒▒▒▒▒▒▒▒▒▒▒▒▒▒▒▒▒▒
// EXIT ============================================================================================================

// INPUT ============================================================================================================
enableTrailing = input.bool(defval = true, title = 'Enable Trailing', tooltip = 'Enable or disable the trailing for exit position.', group = 'Exit')
devExitPerc = input.float(defval = 3.0, title = 'Deviation %', minval = 0.01, maxval = 100, step = 0.05, tooltip = 'The step to follow the price when the open position condition is met.', group = 'Exit') / 100
ctrLongExitSrc = input.source(defval = low, title = 'Source Exit Control', tooltip = 'The source price to compare with the exit price to trigger the exit order when trailing.', group = 'Exit')

// LOGIC ============================================================================================================
var bool exitLongPosition = false

int barsSinceOpenLong = nz(ta.barssince(openLongPosition), 999999)
int barsSinceCloseLong = nz(ta.barssince(closeLongPosition), 999999)
int barsSinceExitLong = nz(ta.barssince(exitLongPosition), 999999)
bool closeLongIsActive = barsSinceOpenLong >= barsSinceCloseLong
bool exitLongIsPending = barsSinceExitLong >= barsSinceCloseLong
bool tryExitLongPosition = isWithinPeriod() and closeLongIsActive and exitLongIsPending

float longExitPrice = na
longExitPrice := if closeLongPosition and strategy.position_size > 0
    close * (1 - devExitPerc)
else if tryExitLongPosition
    math.max(high * (1 - devExitPerc), nz(longExitPrice[1], 999999))
else
    na

exitLongPosition := enableTrailing ? isWithinPeriod() and ta.crossunder(closeLongPosition ? close : ctrLongExitSrc, longExitPrice) : closeLongPosition

// PLOT =============================================================================================================
var sellPriceColor = color.new(#e25141, 0)
plot(series = enableTrailing ? longExitPrice : na, title = 'Long Sell Price', color = sellPriceColor, linewidth = 1, style = plot.style_linebr)

//
// ▒▒▒▒▒▒▒▒▒▒▒▒▒▒▒▒▒▒▒▒▒▒▒▒▒▒▒▒▒▒▒▒▒▒▒▒▒▒▒▒▒▒▒▒▒▒▒▒▒▒▒▒▒▒▒▒▒▒▒▒▒▒▒▒▒▒▒▒▒▒▒▒▒▒▒▒▒▒▒▒▒▒▒▒▒▒▒▒▒▒▒▒▒▒▒▒▒▒▒▒▒▒▒▒▒▒▒▒▒▒▒▒▒▒
// POSITION ORDERS ==================================================================================================

// LOGIC ============================================================================================================
// getting into LONG position
strategy.entry(id = 'Long Entry', direction = strategy.long, when = openLongPosition, alert_message = 'Long(' + syminfo.ticker + '): Started')
// submit close order on trend reversal
strategy.close(id = 'Long Entry', when = exitLongPosition, comment = 'Close Long', alert_message = 'Long(' + syminfo.ticker + '): Closed at market price')

// PLOT =============================================================================================================
var posColor = color.new(color.white, 0)
plot(series = strategy.position_avg_price, title = 'Position', color = posColor, linewidth = 1, style = plot.style_linebr)

// ==================================================================================================================