ダブルEMAゴールデンクロスオシレーション追跡戦略
概要
双EMA金十字振動追跡策略は,EMA指標のトレンド識別を利用して,振動動態で追跡する策略である.この策略は,トレンド追跡と振動捕獲の思想を統合し,強い動きの際に長線追跡を行い,振動動動態の際に短線取引を行い,より良い利益を期待する.
戦略原則
この戦略は,20周期のEMAをトレンドの判断指標として使用する.価格がEMAを突破すると,市場が上昇し始めると考えられる.価格がEMAを突破すると,市場が低下し始めると考えられる.
値上ではEMAを穿ったとき,20周期highestの最高値をストップポイントとして,値上ではEMAを穿った後のlowの最低値をストップポイントとして,多入場する.値下ではEMAを穿ったとき,20周期lowestの最低値をストップポイントとして,値下ではEMAを穿った後のhighの最高値をストップポイントとして,空き入りする.
また,戦略はADXが30より大きいかどうかを判断する.トレンドが十分に明確である,つまりADXが30より高いときにのみ取引を行う.これは,震動の状況でストップ損失を回避する.
トレイルストップは,市場状況に応じて調整され,より多くの利益をロックします.
優位分析
この戦略は,トレンドフォローとショック取引の優位性を組み合わせ,トレンド状況でより高い利益を得ることができ,ショック状況でより安定した利益を得ることができ,強い適応性を持っています.
EMAの適用は,戦略のパラメータを少なくし,過度に最適化のリスクを低減し,戦略の安定性を保証する.
リスク分析
この戦略の主なリスクは,震動が強くなると多くの止損が発生する可能性があることにある.このときADXの作用が顕著になる.ADX値が低いとき,取引を閉鎖し,明確な傾向がないときに損失を避ける.
また,合理的な止損ポイントの設定も鍵である.止損ポイントの設定が過大で,単一損失を増やす可能性がある.止損ポイントの設定が過小で,過度に敏感で,止損の可能性を増やす可能性がある.ここでは,利益目標と止損リスクの間のバランスを求めなければならない.
最適化の方向
この戦略は以下の点で最適化できます.
EMA周期の選択.より多くのEMA周期パラメータをテストして,最適なパラメータの組み合わせを見つけることができます.
ADXのパラメータは最適化できる.ADX周期とADXの値は,異なる設定を試みることができる.
ストップ・ストップ・ロスのアルゴリズムは,ダイナミックなストップ・ストップ・ロスの導入などで改善できる.
KDJ,MACDなどの他の指標を組み合わせて,多指標検証戦略を形成することを検討することができます.
要約する
双EMAゴールドクロス振動トラッキング戦略は,全体的に非常に実用的な戦略である.それは,トレンド戦略と振動戦略の特性を融合し,長線トラッキングにも,短線取引にも使用することができる.パラメータ最適化とコンポーネント指数検証によって,この戦略の効果はさらに向上することができる.それは,市場についてある程度の研究判断能力を持つ投資家に適している.
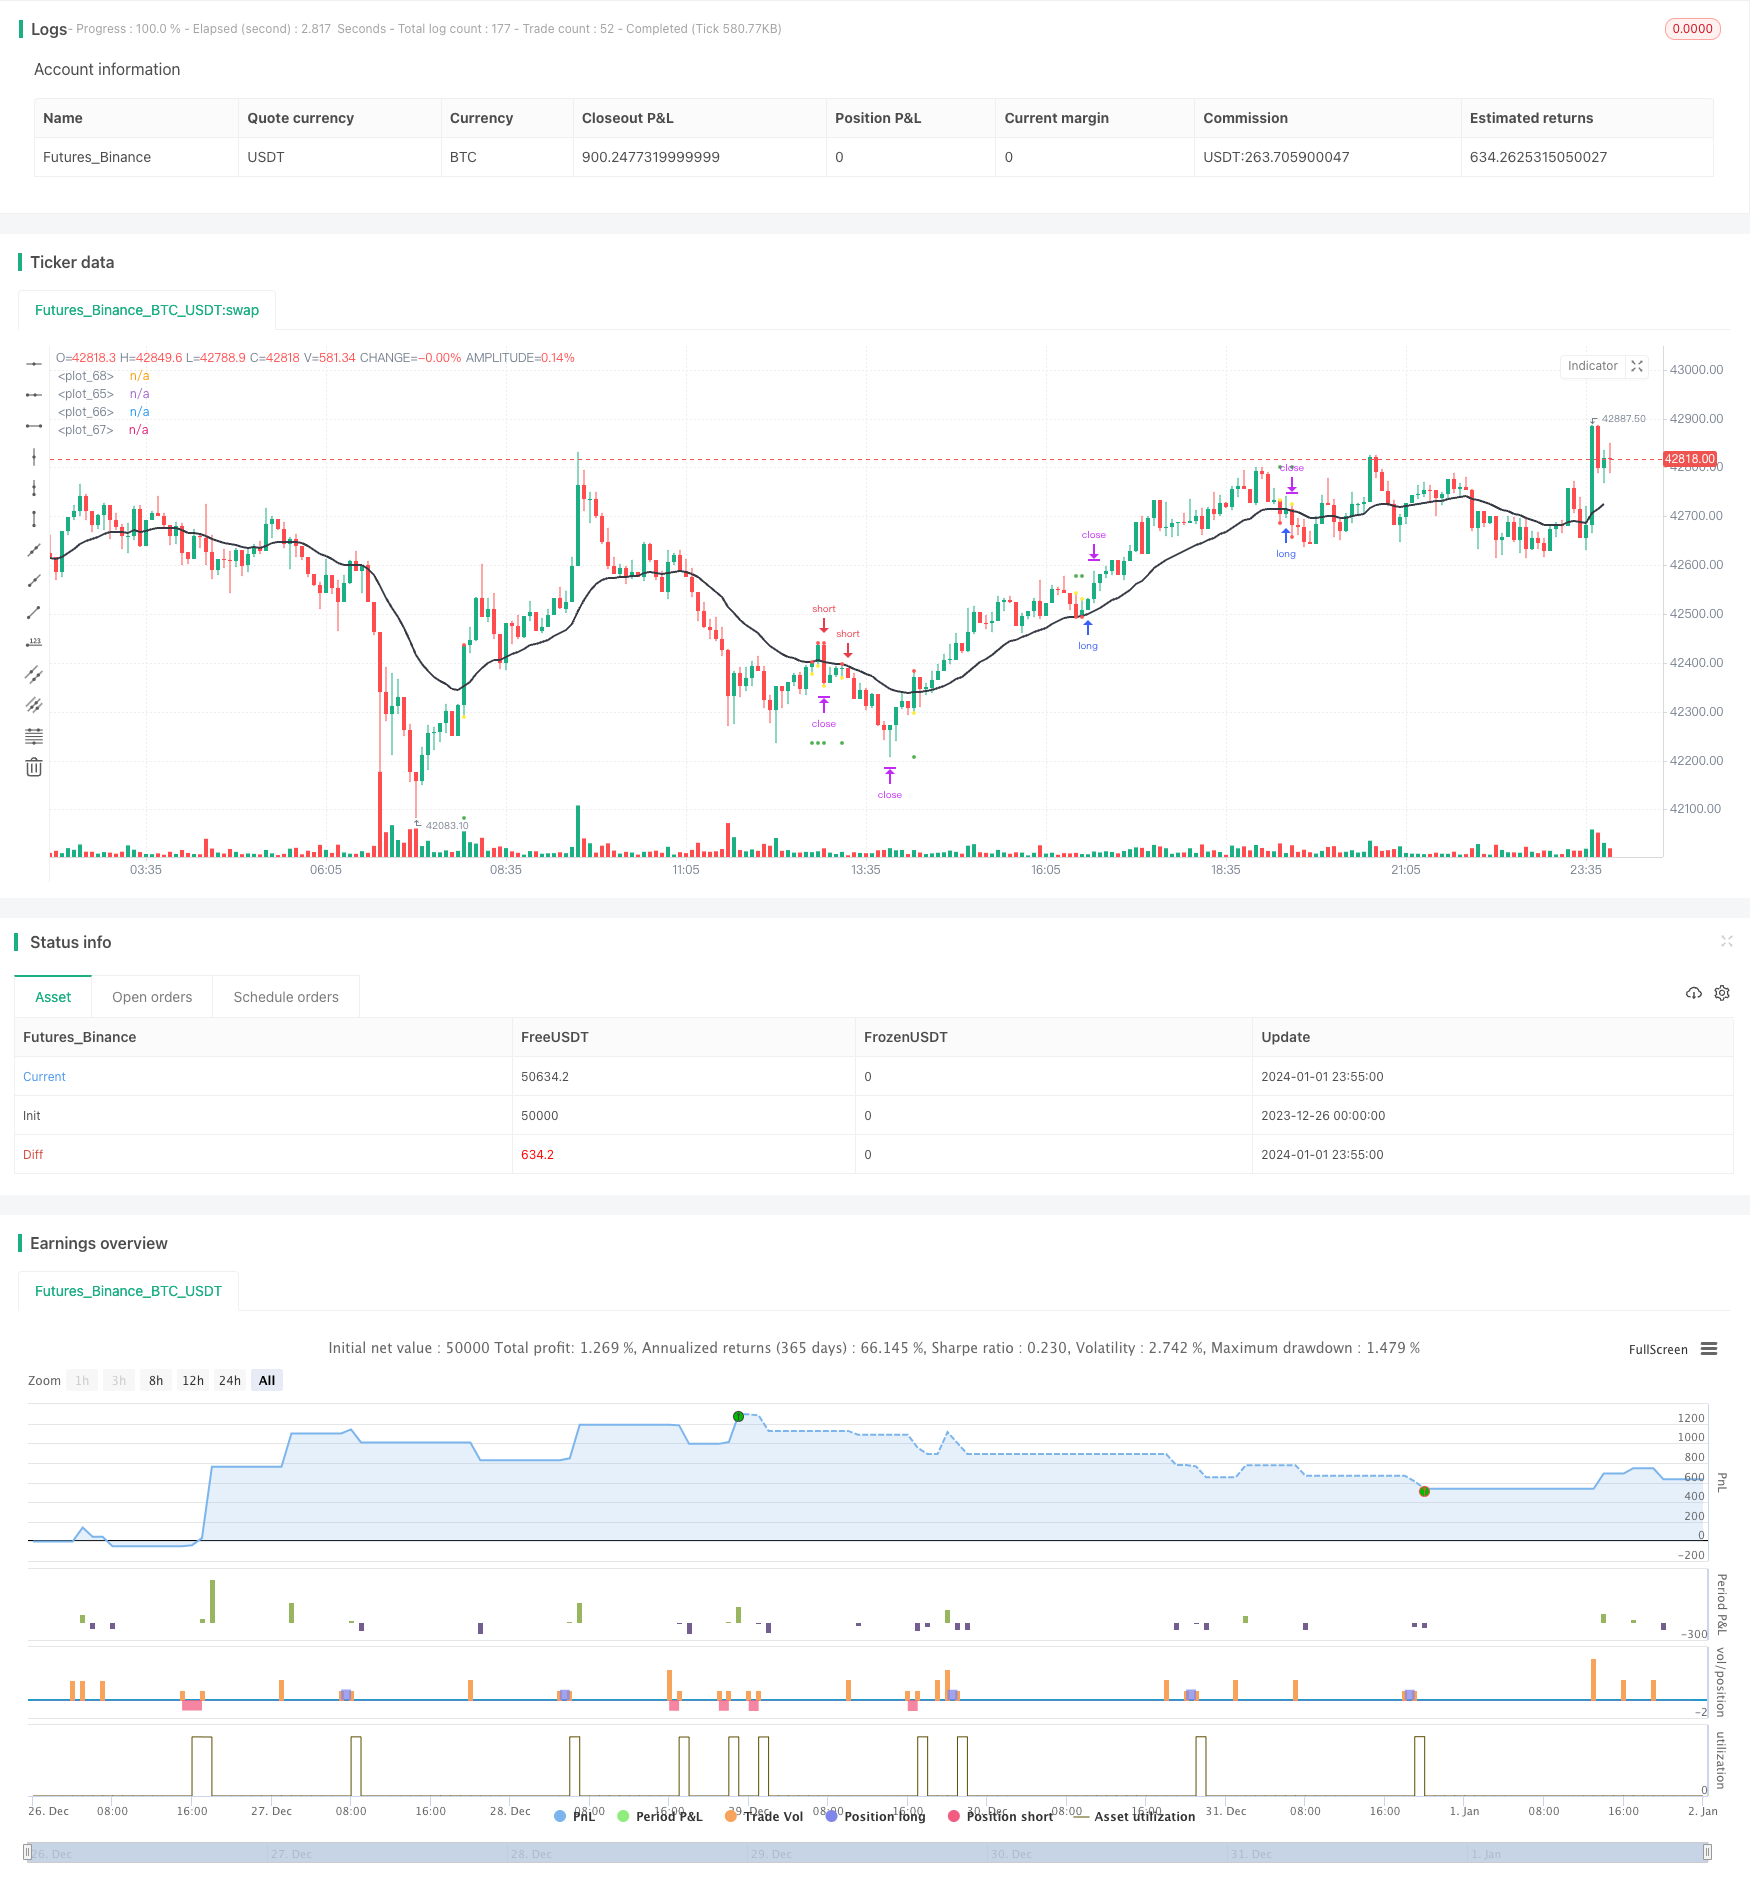
/*backtest
start: 2023-12-26 00:00:00
end: 2024-01-02 00:00:00
period: 5m
basePeriod: 1m
exchanges: [{"eid":"Futures_Binance","currency":"BTC_USDT"}]
*/

//@version=2
strategy("Linda Raschke's Holy Grail", shorttitle="RHG", default_qty_type = strategy.percent_of_equity, default_qty_value = 100, overlay = true)
adxlen = input(14, title="ADX period")
adxMin = input(30)
dilen = adxlen
f_highest(_src, _length)=>
    _adjusted_length = _length < 1 ? 1 : _length
    _value = _src
    for _i = 0 to (_adjusted_length-1)
        _value := _src[_i] >= _value ? _src[_i] : _value
    _return = _value

f_lowest(_src, _length)=>
    _adjusted_length = _length < 1 ? 1 : _length
    _value = _src
    for _i = 0 to (_adjusted_length-1)
        _value := _src[_i] <= _value ? _src[_i] : _value
    _return = _value

dirmov(len) =>
	up = change(high)
	down = -change(low)
	plusDM = na(up) ? na : (up > down and up > 0 ? up : 0)
    minusDM = na(down) ? na : (down > up and down > 0 ? down : 0)
	truerange = rma(tr, len)
	plus = fixnan(100 * rma(plusDM, len) / truerange)
	minus = fixnan(100 * rma(minusDM, len) / truerange)
	[plus, minus]

adx(dilen, adxlen) =>
	[plus, minus] = dirmov(dilen)
	sum = plus + minus
	adx = 100 * rma(abs(plus - minus) / (sum == 0 ? 1 : sum), adxlen)

emaLength = input(20)
curEma = ema(close, emaLength)
highPeriod = input(20)
d = na

takeProfitLong = highest(high, highPeriod)
stopLossLong = f_lowest(low, barssince(low >= curEma))

if strategy.position_size == 0
    if adx(dilen, adxlen) <= adxMin or high < curEma
        strategy.cancel("Long")
    if adx(dilen, adxlen) > adxMin and low < curEma and high > curEma and curEma > curEma[highPeriod / 2] and curEma > curEma[highPeriod] and takeProfitLong > high
        strategy.order("Long", strategy.long, stop = high)
        strategy.exit("Exit", "Long", limit = takeProfitLong, stop = stopLossLong)
        d := high

takeProfitShort = lowest(low, highPeriod)
stopLossShort = f_highest(high, barssince(high <= curEma))

if strategy.position_size == 0
    if adx(dilen, adxlen) <= adxMin or low > curEma
        strategy.cancel("Short")
    if adx(dilen, adxlen) > adxMin and high > curEma and low < curEma and curEma < curEma[highPeriod / 2] and curEma < curEma[highPeriod] and takeProfitShort < low
        strategy.order("Short", strategy.short, stop = low)
        strategy.exit("Exit", "Short", limit = takeProfitShort, stop = stopLossShort)
        d := low


strategy.close("Exit")

plot(d == high ? stopLossLong : d == low ? stopLossShort : na, style = circles, linewidth = 4, color = red)
plot(d == high ? takeProfitLong : d == low ? takeProfitShort : na, style = circles, linewidth = 4, color = green)
plot(d, style = circles, linewidth = 4, color = yellow)
plot(curEma, color = black, linewidth = 2)

// === Backtesting Dates ===
testPeriodSwitch = input(false, "Custom Backtesting Dates")
testStartYear = input(2018, "Backtest Start Year")
testStartMonth = input(3, "Backtest Start Month")
testStartDay = input(6, "Backtest Start Day")
testStartHour = input(08, "Backtest Start Hour")
testPeriodStart = timestamp(testStartYear,testStartMonth,testStartDay,testStartHour,0)
testStopYear = input(2018, "Backtest Stop Year")
testStopMonth = input(12, "Backtest Stop Month")
testStopDay = input(14, "Backtest Stop Day")
testStopHour = input(14, "Backtest Stop Hour")
testPeriodStop = timestamp(testStopYear,testStopMonth,testStopDay,testStopHour,0)
testPeriod() =>
    time >= testPeriodStart and time <= testPeriodStop ? true : false
isPeriod = testPeriodSwitch == true ? testPeriod() : true
// === /END
if not isPeriod
    strategy.cancel_all()
    strategy.close_all()