重要なバーフィルタリングに基づくブレイクアウト蓄積戦略
概要
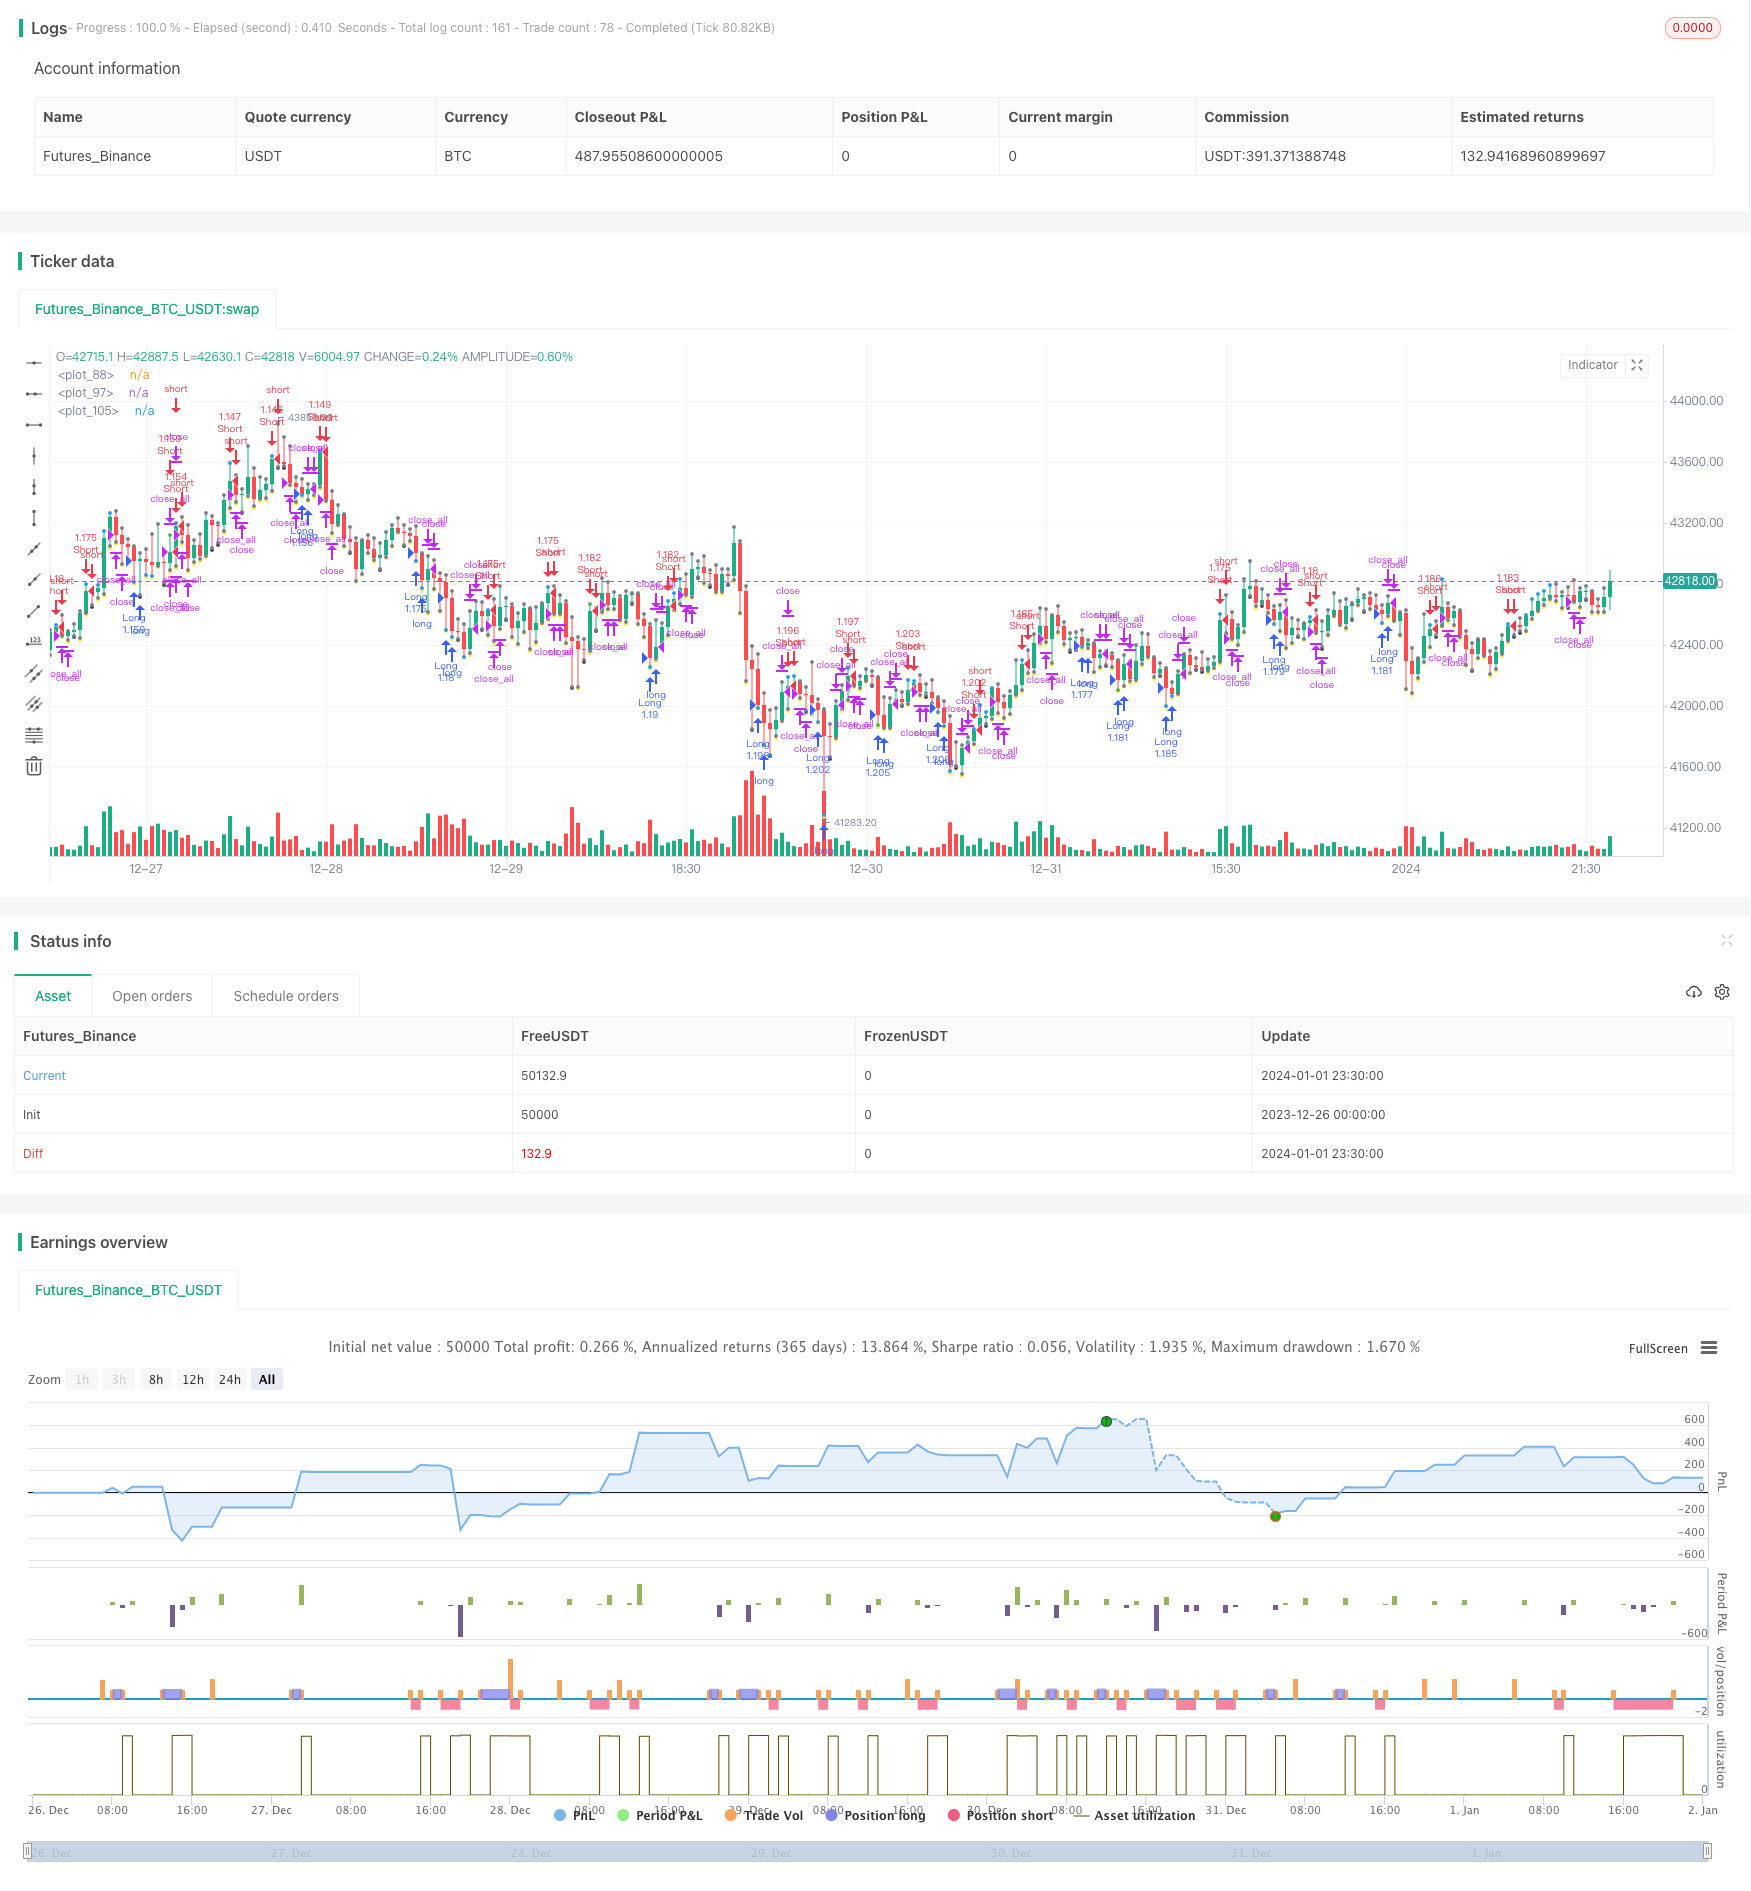
この戦略は,K線の意柱のを判断してトレンドを予測し,突破信号と組み合わせて取引信号を発信する.戦略は,過小のK線をフィルターして,意柱ののみを分析し,過度に頻繁な小落によって干渉されないようにし,信号をより平坦に安定的に信頼できるようにする.
戦略原則
現在のK線の実体長bodyを判断すると,過去6つのK線bodyの平均値の3倍以上である場合は,意柱線であると考えます.
連続3根意柱線が陽線であれば,多頭信号と判断する.連続3根意柱線が陰線であれば,空頭信号と判断する.
判断信号と同時に,価格が突破する前に高点または低点があれば,追加取引信号も生成されます.
SMA均線をフィルターとして使用し,価格がSMAを突破したときにのみポジションを開きます.
ポジションを保持した後,価格が再びエントリーポイントまたはSMA平均線を突破した場合,平仓する.
優位分析
の意味の柱のを使ってトレンドを判断し,不必要な干渉を過濾して信号をより明確にする.
トレンド信号とブレイク信号を組み合わせることで,信号の質を高め,偽信号を減らすことができる.
SMA均線フィルタは,高殺低の追尾を回避する.Closing以下で買い,Closing以上で売り,信号の信頼性を高める.
ストップ・ストップ・損失の条件を設定し,早期にストップ・損失を止めることができ,資金の保存に役立ちます.
リスク分析
この戦略は,より激進的で,3つのK線判断信号を使用し,短期的な振動をトレンドの逆転と誤判する可能性があります.
検査データは不十分で,種や周期によって効果が異なる可能性があります.
夜盤の夜間ポジション管理が加入されていないため,夜間ポジションのリスクがある.
最適化の方向
意義柱線のパラメータは,判断されたK線の数,意義の定義など,さらに最適化することができる.
異なる周期パラメータによる効果の影響をテストし,最適な周期を探します.
ATR ストップを追加してリスクをコントロールできます.
夜間ポジション制御ロジックを追加することも検討できます.
要約する
この策略は,意味の柱線フィルター波動とトレンド判断を利用し,突破形成取引信号と組み合わせて,不要な小さな波動を効率的にフィルターし,信号をより明確に信頼できます.しかし,判断周期が短いため,一定の誤判リスクがある可能性があります.パラメータ最適化と風力制御手段によってさらに完善することができます.
/*backtest
start: 2023-12-26 00:00:00
end: 2024-01-02 00:00:00
period: 30m
basePeriod: 15m
exchanges: [{"eid":"Futures_Binance","currency":"BTC_USDT"}]
*/

//AlexInc
//2018

// закрытие - вычислить и в течение скольки-то баров его добиваться
// если нет, то по первому противоположному
// по стоп-лоссу в любом случае - стоп вычислить

//@version=2
strategy(title = "AlexInc's Bar v1.2", shorttitle = "AlexInc Bar 1.2", overlay = true, default_qty_type = strategy.percent_of_equity, default_qty_value = 100, pyramiding = 0)

//Settings
needlong = input(true, defval = true, title = "Long")
needshort = input(true, defval = true, title = "Short")
usemar = input(false, defval = false, title = "Use Martingale")
tryprofitbars = input(6, defval = 6, minval = 1, maxval = 100, title = "Number of candles to take profit anyway")
capital = input(100, defval = 100, minval = 1, maxval = 10000, title = "Capital, %")

useSMAfilter = input(false, defval = true, title = "Use SMA filter")
SMAlimit = input(10, defval = 10, minval = 1, maxval = 30, title = "SMA filter limit")
bodysizeMlt = input(3, defval = 3, minval = 1, maxval = 10, title = "Body Size Multiplier")
meanfulbardiv = input(3, title = "Meanful Bar size Divider")

showarr = input(false, defval = false, title = "Show Arrows")
fromyear = input(2018, defval = 2018, minval = 1900, maxval = 2100, title = "From Year")
toyear = input(2100, defval = 2100, minval = 1900, maxval = 2100, title = "To Year")
frommonth = input(01, defval = 01, minval = 01, maxval = 12, title = "From Month")
tomonth = input(12, defval = 12, minval = 01, maxval = 12, title = "To Month")
fromday = input(01, defval = 01, minval = 01, maxval = 31, title = "From day")
today = input(31, defval = 31, minval = 01, maxval = 31, title = "To day")

//SMA #
index = 0
index := barstate.isfirst ==true ? 0 : nz(index[1])+1

buyindex = 0
buyindex := barstate.isfirst ==true ? 0 : buyindex[1]

sellindex = 0
sellindex := barstate.isfirst ==true ? 0 : sellindex[1]

//predictprofit = barstate.isfirst ==true ? 0 : predictprofit[1]

smafilter = sma(close, SMAlimit)

//Body
body = abs(close - open)
range = abs(high - low)
abody = sma(body, 6)

max3 = 0
if body >= body[1] and body >= body[2]
    max3 := body
else
    if body[1] >= body and body[1] >= body[2]
        max3 := body[1]
    else
        if body[2] >= body and body[2] >= body[1]
            max3 := body[2]

prevmax3 = 0
prevmax3 := nz(max3[1])


bar = close > open ? 1 : close < open ? -1 : 0
firstbullishopen = 0
firstbullishopen := bar == 1 and bar[1] != 1 ? open : nz(firstbullishopen[1])
firstbearishopen = 0
firstbearishopen := bar == -1 and bar[1] != -1 ? open : nz(firstbearishopen[1])

meanfulbar = body > abody / meanfulbardiv

meanfulbearish = 0
meanfulbearish := nz(meanfulbearish[1])

meanfulbullish = 0
meanfulbullish := nz(meanfulbullish[1])

if meanfulbar
    if bar == 1
        meanfulbullish := 1 + meanfulbullish
        meanfulbearish := 0
    else
        if bar == -1
            meanfulbearish := 1 + meanfulbearish
            meanfulbullish := 0


plot(min(low, high)-10, style=circles, color = meanfulbar ? yellow:black, linewidth=3)

//Signals
up1 = (meanfulbearish >= 3) and (close < firstbullishopen or 1) and (strategy.position_size == 0 or close < strategy.position_avg_price) and body > abody / 5 and (useSMAfilter == false or close < smafilter)
if up1 == true
	predictprofit = sma(body, 3)
up2 = sma(bar, 1) == -1 and body > prevmax3 * bodysizeMlt and (strategy.position_size == 0 or close < strategy.position_avg_price) and body > abody / 5 and (useSMAfilter == false or close < smafilter)
if up2 == true
	predictprofit = body * 0.5
plot(min(low, high), style=circles, color = up1?blue:up2?green:gray, linewidth=3)

dn1 = (meanfulbullish >= 3) and (close > firstbearishopen or 1)  and (strategy.position_size == 0 or close > strategy.position_avg_price) and body > abody / 5 and (useSMAfilter==false or close > smafilter)
if dn1 ==true
	predictprofit = sma(body, 3)
dn2 = sma(bar, 1) == 1 and body > prevmax3 * bodysizeMlt and (strategy.position_size == 0 or close > strategy.position_avg_price) and body > abody / 5 and (useSMAfilter==false or close > smafilter)
if dn2 ==true
	predictprofit = body * 0.5
plot(max(low, high), style=circles, color = dn1?blue:dn2?green:gray, linewidth=3)


exit = (((strategy.position_size > 0 and bar == 1 ) or (strategy.position_size < 0 and bar == -1)) and body > abody / 2 )
// or index >= buyindex (or sellindex) + tryprofitbars


//Arrows
col = exit ? black : up1 or dn1 ? blue : up2 or dn2 ? red : na
needup = up1 or up2
needdn = dn1 or dn2
needexitup = exit and strategy.position_size < 0
needexitdn = exit and strategy.position_size > 0
plotarrow(showarr and needup ? 1 : na, colorup = blue, colordown = blue, transp = 0)
plotarrow(showarr and needdn ? -1 : na, colorup = blue, colordown = blue, transp = 0)
plotarrow(showarr and needexitup ? 1 : na, colorup = black, colordown = black, transp = 0)
plotarrow(showarr and needexitdn ? -1 : na, colorup = black, colordown = black, transp = 0)


//Trading
profit = exit ? ((strategy.position_size > 0 and close > strategy.position_avg_price) or (strategy.position_size < 0 and close < strategy.position_avg_price)) ? 1 : -1 : profit[1]
mult = usemar ? exit ? profit == -1 ? mult[1] * 2 : 1 : mult[1] : 1
lot = strategy.position_size == 0 ? strategy.equity / close * capital / 100 * mult : lot[1]

if up1 or up2
    if strategy.position_size < 0
        strategy.close_all()
		buyindex = index
		sellindex = index
	if strategy.position_size == 0
		buyindex = index


    strategy.entry("Long", strategy.long, needlong == false ? 0 : lot )

if dn1 or dn2
    if strategy.position_size > 0
        strategy.close_all()
		buyindex = index
		sellindex = index
	if strategy.position_size == 0
		sellindex = index

    strategy.entry("Short", strategy.short, needshort == false ? 0 : lot )

if  exit
    strategy.close_all()