ATRとボラティリティ指数に基づくトレンドフォロー戦略
作成日:
2024-01-04 15:31:34
最終変更日:
2024-01-04 15:31:34
コピー:
1
クリック数:
692
1
フォロー
1750
フォロワー
概要
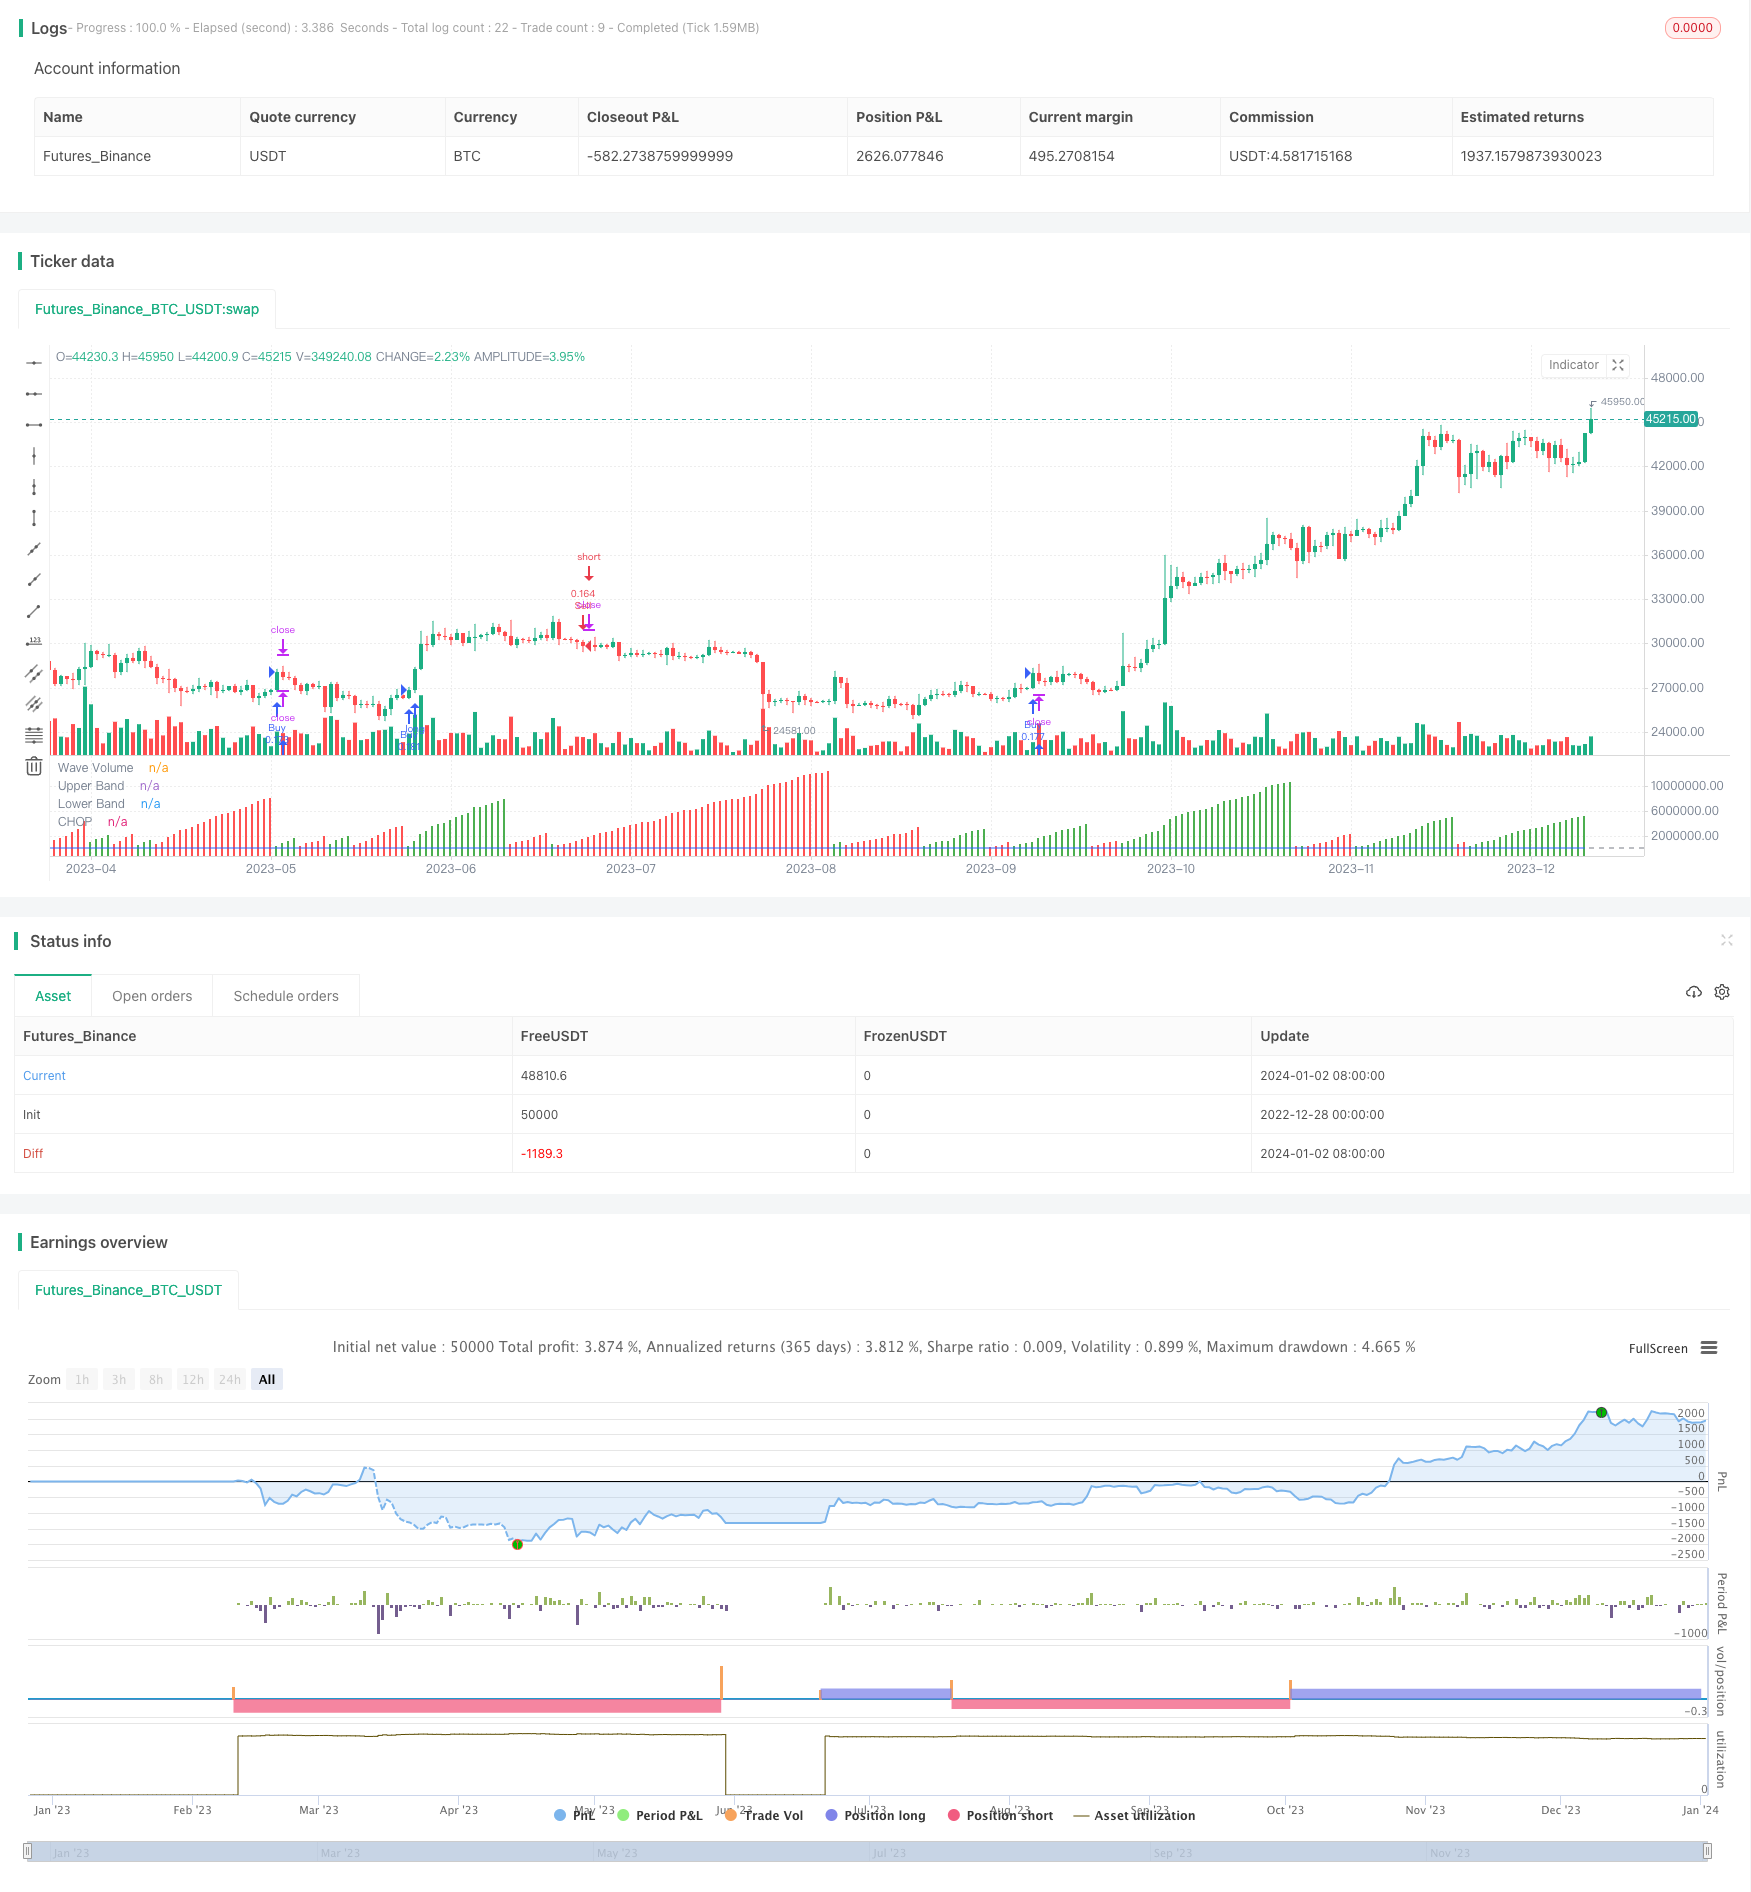
この戦略は,平均真振幅 (ATR) と波動性指数 (CHOP) を主要な技術指標として使用し,トレンドの識別と追跡を実現する.指数が上下線を突破すると,トレンドの方向を組み合わせて入場信号として;指数が帯状領域に戻ると,ストップ・ロースまたはストップ・エグジットの位置をとる.
戦略原則
- ATRを使用して箱体サイズを計算し,リポーク通路を構成し,価格傾向の方向を判断する.
- CHOP指標は,最高価格,最低価格とATRを組み合わせて,市場が取引に適しているかどうかを判断します. 38.2-61.8の範囲にある場合は,市場の変動が緩やかであることを示します.
- CHOP指標が61.8の上線から下線に突破すると,価格は下行傾向に入り,短期急激のEMAも価格をリードしている場合は空き;逆にCHOPが38.2の下線から上線に突破し,短期EMAが上昇すると,空き.
- ストップ・ストップ・ストラトジーを用いて,価格がCHOPの38.2-61.8帯状領域に戻ったときにストップまたはストップします.
戦略的優位分析
この戦略は,トレンド判断と変動制御を組み合わせて,価格トレンドを捉えながらもリスクをコントロールする,比較的安定したトレンド追跡戦略である.
- ATRで構築されたリポックチャネルを使用すると,価格の動向を効果的に追跡できます.
- CHOP指数は,市場の変動率を判断し,激しい波動の中で誤った取引を避ける.
- 短期トレンドの方向を判断するEMAと組み合わせて,逆操作を避ける.
- ストップ・ストップ・ストラスト戦略は単発損失を制御する.
リスク分析
この戦略の主なリスクは以下の通りです.
- 震動状況では,ATRチャネルとCHOP指標が誤信号を生じることがあります.誤信号を排除するためにパラメータを適切に調整できます.
- 単一の技術指標の組み合わせで損失を完全に回避することは不可能で,大きなトレンドを決定するために人工的介入が必要である.
- 止損位置は余りにも緩やかな設定で,単一の損失は過大である可能性があります.適切な止損幅を小さくする必要があります.
戦略最適化の方向性
この戦略は以下の点で最適化できます.
- K線形状,交差量など,他の補助指標判断信号を追加して,信号の精度を向上させる.
- ATRとCHOPのパラメータを最適化して,価格変動をよりよく捉える.
- ダイナミック・ストップ・ダメージ・ストップの位置を設定して,ストップスペースを大きくして,ストップ・ダメージを早くする.
- 大規模なトレンドを判断した後,トレンドの中でより大きな利益を得るために,適切な止損範囲を緩める.
要約する
この戦略は,常用技術指標を統合し,シンプルで実用的である.パラメータ調整の最適化により,良い追跡効果を得ることができる.しかし,大きなトレンドを人工的に判断する必要が依然としてあり,完全に自動化することはできない.補助的な意思決定ツールとして使用でき,他の戦略の参考参考となるものにもなる.
ストラテジーソースコード
/*backtest
start: 2022-12-28 00:00:00
end: 2024-01-03 00:00:00
period: 1d
basePeriod: 1h
exchanges: [{"eid":"Futures_Binance","currency":"BTC_USDT"}]
*/

// This source code is subject to the terms of the Mozilla Public License 2.0 at https://mozilla.org/MPL/2.0/
// © sharatgbhat

//@version=4
strategy("Weis Chop Strategy", overlay=false, default_qty_type = strategy.percent_of_equity, default_qty_value = 10,max_lines_count = 500, max_labels_count = 500)
maxIdLossPcnt = input(1, "Max Intraday Loss(%)", type=input.float)
// strategy.risk.max_intraday_loss(maxIdLossPcnt, strategy.percent_of_equity)

method = input(defval="ATR", options=["ATR", "Traditional", "Part of Price"], title="Renko Assignment Method")
methodvalue = input(defval=14.0, type=input.float, minval=0, title="Value")
pricesource = input(defval="Close", options=["Close", "Open / Close", "High / Low"], title="Price Source")
useClose = pricesource == "Close"
useOpenClose = pricesource == "Open / Close" or useClose
useTrueRange = input(defval="Auto", options=["Always", "Auto", "Never"], title="Use True Range instead of Volume")
isOscillating = input(defval=false, type=input.bool, title="Oscillating")
normalize = input(defval=false, type=input.bool, title="Normalize")
vol = useTrueRange == "Always" or useTrueRange == "Auto" and na(volume) ? tr : volume
op = useClose ? close : open
hi = useOpenClose ? close >= op ? close : op : high
lo = useOpenClose ? close <= op ? close : op : low

if method == "ATR"
    methodvalue := atr(round(methodvalue))
if method == "Part of Price"
    methodvalue := close / methodvalue

currclose = float(na)
prevclose = nz(currclose[1])
prevhigh = prevclose + methodvalue
prevlow = prevclose - methodvalue
currclose := hi > prevhigh ? hi : lo < prevlow ? lo : prevclose

direction = int(na)
direction := currclose > prevclose ? 1 : currclose < prevclose ? -1 : nz(direction[1])
directionHasChanged = change(direction) != 0
directionIsUp = direction > 0
directionIsDown = direction < 0

barcount = 1
barcount := not directionHasChanged and normalize ? barcount[1] + barcount : barcount
vol := not directionHasChanged ? vol[1] + vol : vol
res = barcount > 1 ? vol / barcount : vol

plot(isOscillating and directionIsDown ? -res : res, style=plot.style_columns, color=directionIsUp ? color.green : color.red, transp=75, linewidth=3, title="Wave Volume")

length = input(14, minval=1)
ci = 100 * log10(sum(atr(1), length) / (highest(length) - lowest(length))) / log10(length)
offset = input(0, "Offset", type = input.integer, minval = -500, maxval = 500)
plot(ci, "CHOP", color=#2962FF, offset = offset)
band1 = hline(61.8, "Upper Band", color=#787B86, linestyle=hline.style_dashed)
band0 = hline(38.2, "Lower Band", color=#787B86, linestyle=hline.style_dashed)
fill(band1, band0, color = color.rgb(33, 150, 243, 90), title = "Background")

MomentumBull = close>ema(close,8)
MomentumBear = close<ema(close,8)
Tradecon = crossunder(ci,61.8)

if (MomentumBull and directionIsUp and Tradecon)
	strategy.entry("Buy", strategy.long)
if (MomentumBear and directionIsDown and Tradecon )
    strategy.entry("Sell", strategy.short)
    strategy.exit("exit","Buy",when=directionIsDown,qty_percent=100,profit=20,loss=10)
    strategy.exit("exit","Sell",when=directionIsUp,qty_percent=100,profit=20,loss=10)