アダプティブブルウィンクルインジケーターロングショート戦略
概要 (Overview)
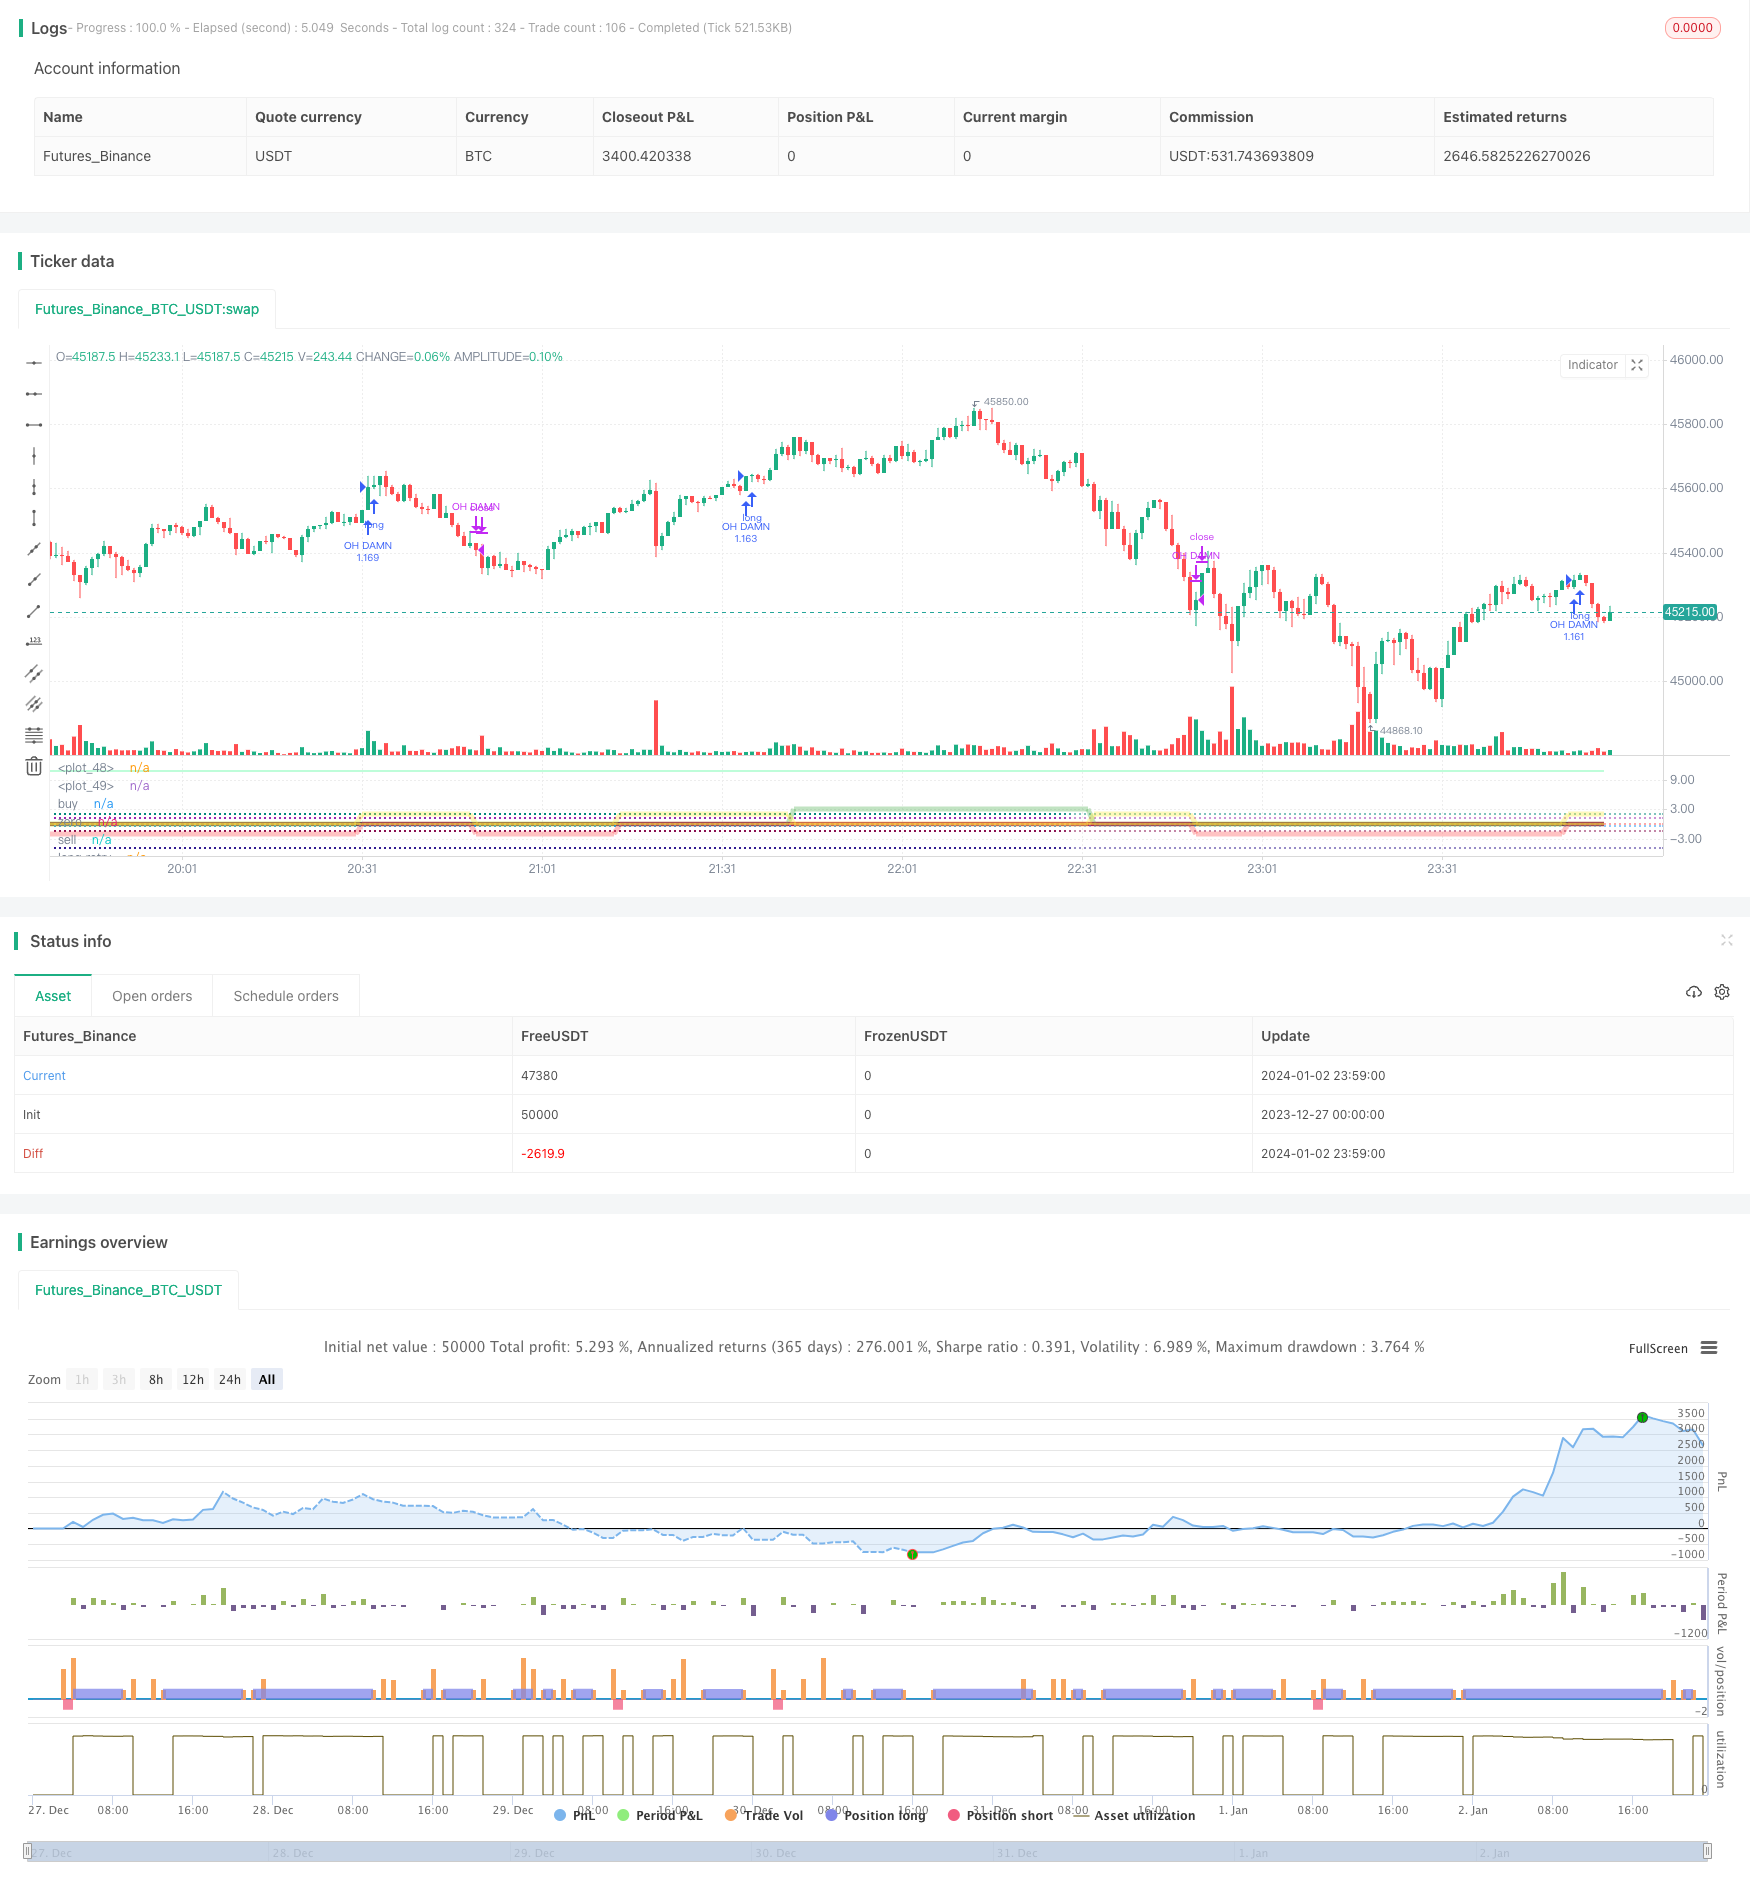
この戦略は,ブインコ指数に基づいて,市場トレンドを自動的に認識し,空白ポジションを確立する.ブインコ指数,移動平均,水平サポートラインなどの技術指標を統合し,突破信号を自動的に認識し,ポジションを確立する.
戦略原則
この戦略の核心指標は,ブインコ指数で,異なる取引日の閉店価格の対数差値を計算することによって,市場の傾向と重要なサポート/レジスタンスレベルを判断する.指数が特定の水平線を横切るときは多し,横切るときは空にする.
さらに,この戦略は,21日,55日などの複数の移動平均で構成されるEMA保護帯を統合している.これらの均線の順序関係によって,現在,多頭市場,空頭市場または整合市場であると判断し,空売りまたは多操作を適切に制限している.
ブウィンコ指数は取引信号を識別し,移動平均は市場の段階を判断し,両方を組み合わせて使用することで,不適切なポジション構築を回避できます.
アドバンテージ分析
この戦略の最大の利点は,市場の多空傾向を自動的に識別できることです.ブインコ指標は,二つの時間帯の価格の差値に非常に敏感であり,重要なサポートレジスタンスを迅速に特定することができます.同時に,移動平均の排列は,現在の状況を見極めるのに有効です.
急速指数とトレンド指数を組み合わせたこの考え方は,戦略が買い買いを迅速に特定し,不適切な買い買いを防止することを可能にします.これは,この戦略の最大の利点です.
リスク分析
この戦略のリスクは,主に2つの側面から生じます.一つは,ブインコ指数自体は価格の変化に非常に敏感であり,多くの不必要な取引シグナルを生成する可能性があります.二つは,移動平均が横横に並べられたときに混乱を排列し,ポジションの混乱を起こすことです.
第”のリスクには,ブインコ指数のパラメータを適切に調整して,指数の計算周期を増やし,不必要な取引を減らすことができます.第2のリスクには,より多くの移動平均を追加して,傾向を判断することをより正確にすることができます.
オプティマイゼーション・ディレクション
この戦略の主な最適化方向は,パラメータの調整とフィルタリング条件の追加である.
ブウィンコ指数については,異なる周期パラメータを試して最適なパラメータの組み合わせを見つけることができる.移動平均については,より多くの平均線を追加し,より完全なトレンド判断システムを形成することができる.さらに,波動率指数,取引量指数などのフィルタ条件を追加して,偽信号を低減することができる.
パラメータと条件の総合的な調整により,戦略の安定性と収益性をさらに向上させることができます.
概要 (Summary)
この自己適応ブインコド空間の戦略は,迅速な指標とトレンド指標を成功裏に組み合わせて,市場の重要なポイントを自動的に識別し,正しいポジションを構築することができる.その優点は,迅速な位置付けと不適切なポジション構築を防止する能力である.次のステップは,パラメータと条件の最適化により,戦略の安定性と収益性のレベルをさらに向上させることができる.
/*backtest
start: 2023-12-27 00:00:00
end: 2024-01-03 00:00:00
period: 1m
basePeriod: 1m
exchanges: [{"eid":"Futures_Binance","currency":"BTC_USDT"}]
*/

// This source code is subject to the terms of the Mozilla Public License 2.0 at https://mozilla.org/MPL/2.0/
// © boftei

//@version=5

strategy("Boftei's Strategy", overlay=false, pyramiding=1, default_qty_type= strategy.percent_of_equity, default_qty_value = 100, calc_on_order_fills=false, margin_long = 100, margin_short = 100, slippage=0, commission_type=strategy.commission.percent, commission_value = 0, initial_capital = 40, precision = 6)
strat_dir_input = input.string("all", "strategy direction", options=["long", "short", "all"])
strat_dir_value = strat_dir_input == "long" ? strategy.direction.long : strat_dir_input == "short" ? strategy.direction.short : strategy.direction.all
strategy.risk.allow_entry_in(strat_dir_value)
//////////////////////////////////////////////////////////////////////
//DATA
testStartYear = input(2005, "Backtest Start Year")
testStartMonth = input(7, "Backtest Start Month")
testStartDay = input(16, "Backtest Start Day")
testPeriodStart = timestamp(testStartYear,testStartMonth,testStartDay,0,0)
//Stop date if you want to use a specific range of dates
testStopYear = input(2030, "Backtest Stop Year")
testStopMonth = input(12, "Backtest Stop Month")
testStopDay = input(30, "Backtest Stop Day")
testPeriodStop = timestamp(testStopYear,testStopMonth,testStopDay,0,0)


testPeriod() =>
    time >= testPeriodStart and time <= testPeriodStop ? true : false
//////////////////////////////////////////////////////////////////////
sell = input.float(0.0065, "sell level")
buy = input.float(0, "buy level")
long1 = input.float(-0.493, "long retry - too low")
long2 = input.float(2, "long close up")
long3 = input.float(-1.5, "long close down")
short1 = input.float(1.26, "short retry - too high")
short2 = input.float(-5, "dead - close the short")
///< botvenko script
nn = input(60, "Histogram Period")
float x = 0
float z = 0
float k = 0


y = math.log(close[0]) - math.log(close[nn])
if y>0
    x := y
else
    k := y
//---------------------------------------------

plot(y > 0 ? x: 0, color = color.green, linewidth = 4)
plot(y <= 0 ? k: 0, color = color.maroon, linewidth = 4)
plot(y, color = color.yellow, linewidth = 1)

co = ta.crossover(y, buy)
cu = ta.crossunder(y, sell)
retry_long = ta.crossunder(y, long1)
deadline_long_up = ta.crossover(y, long2)
deadline_long_down = ta.crossunder(y, long3)
retry_short = ta.crossover(y, short1)
deadline_short = ta.crossunder(y, short2)


hline(buy, title='buy', color=color.green, linestyle=hline.style_dotted, linewidth=2)
hline(0, title='zero', color=color.white, linestyle=hline.style_dotted, linewidth=1)
hline(sell, title='sell', color=color.red, linestyle=hline.style_dotted, linewidth=2)
hline(long1, title='long retry', color=color.blue, linestyle=hline.style_dotted, linewidth=2)
hline(long2, title='overbought', color=color.teal, linestyle=hline.style_dotted, linewidth=2)
hline(long3, title='oversold', color=color.maroon, linestyle=hline.style_dotted, linewidth=2)
hline(short1, title='short retry', color=color.purple, linestyle=hline.style_dotted, linewidth=2)
hline(short2, title='too low to short - an asset may die', color=color.navy, linestyle=hline.style_dotted, linewidth=2)


////////////////////////////////////////////////////////////EMAprotectionBLOCK
ema_21 = ta.ema(close, 21)
ema_55 = ta.ema(close, 55)
ema_89 = ta.ema(close, 89)
ema_144 = ta.ema(close, 144)
//ema_233 = ta.ema(close, 233)
// ema_377 = ta.ema(close, 377)

long_st = ema_21>ema_55 and ema_55>ema_89 and ema_89>ema_144 //and ema_144>ema_233 and ema_233>ema_377
short_st = ema_21<ema_55 and ema_55<ema_89 and ema_89<ema_144 //and ema_144<ema_233 and ema_233<ema_377

g_v = long_st == true?3:0
r_v = short_st == true?-2:0
y_v = long_st != true and short_st != true?2:0

plot(math.log(ema_21), color = color.new(#ffaf5e, 50))
plot(math.log(ema_55), color = color.new(#b9ff5e, 50))
plot(math.log(ema_89), color = color.new(#5eff81, 50))
plot(math.log(ema_144), color = color.new(#5effe4, 50))
//plot(math.log(ema_233), color = color.new(#5e9fff, 50))
//plot(math.log(ema_377), color = color.new(#af5eff, 50))

plot(long_st == true?3:0, color = color.new(color.green, 65), linewidth = 5)
plot(short_st == true?-2:0, color = color.new(color.red, 65), linewidth = 5)
plot(long_st != true and short_st != true?2:0, color = color.new(color.yellow, 65), linewidth = 5)
////////////////////////////////////////////////////////////EMAprotectionBLOCK


if (co and testPeriod() and (g_v == 3 or y_v == 2))
    strategy.close("OH BRO", comment = "EXIT-SHORT")
    strategy.close("OH DUDE", comment = "EXIT-SHORT")
	strategy.entry("OH DAMN", strategy.long, comment="ENTER-LONG 'co'")
if (retry_long and testPeriod() and (g_v == 3 or y_v == 2))
    strategy.close("OH DAMN", comment = "EXIT-LONG")
    strategy.entry("OH BRUH", strategy.long, comment="ENTER-LONG 'retry_long'")

if (cu and testPeriod() and (r_v == -2 or y_v == 2))
    strategy.close("OH DAMN", comment = "EXIT-LONG")
    strategy.close("OH BRUH", comment = "EXIT-LONG")
	strategy.entry("OH BRO", strategy.short, comment="ENTER-SHORT 'cu'")
if (retry_short and testPeriod() and (r_v == -2 or y_v == 2))
    strategy.close("OH BRO", comment = "EXIT-SHORT")
    strategy.entry("OH DUDE", strategy.short, comment="ENTER-SHORT 'retry_short'")


if (deadline_long_up and testPeriod() or r_v == -2 and testPeriod())
    strategy.close("OH DAMN", comment = "EXIT-LONG 'deadline_long_up'")
if (deadline_long_down and testPeriod())
    strategy.close("OH DAMN", comment = "EXIT-LONG 'deadline_long_down'")
if (deadline_short and testPeriod() or g_v == 3 and testPeriod())
    strategy.close("OH BRO", comment = "EXIT-SHORT 'deadline_short'")
    // (you can use strategy.close_all(comment = "close all entries") here)