動的平均コスト固定投資複利戦略
概要
動的平均コスト定投利戦略は,動的に開設するたびに開設する数を調整し,トレンドの開始段階で少量開設し,整理深度が増加するにつれて徐々にポジションを拡大する.戦略は,指数関数を使用して,各層のストップ損失価格を計算し,再分批の新規開設を誘発し,ポジションの維持コストラインを指数レベルで下行させることができる.深度が増加するにつれて,ポジションコストは徐々に下方へ圧縮され,価格が逆転した後に分批のストップオフが出場して,より大きな利益を得ることができる.
戦略原則
この戦略は,簡単なRSI超売りポイントシグナルの組み合わせで均線選択時にポジション開設のタイミングを選択する. RSIが超売りラインを下回り,閉店価格が平均線より小さいときに最初の開設シグナルが生じる. 最初の開設後,インデックス関数によって価格の破綻幅の下限が計算され,DCAシグナルが生成される. DCAの回数が増加するにつれて,保有コストは低下し,毎回のストップオフは,わずかな反発で利益を得ることができます. 連続して複数の単発を開いた後,平均価格の上部にストップ・ロス・ラインを描く.価格が再び上方突破し,保有平均価格とストップ・ロス・ラインを上回れば,出場を停止する.
戦略の最大の利点は,保有コストが低下するにつれて,市場を清算しても,コストを累積的に削減できるということです.トレンドが逆転した後に,保有コストが市場価格より大幅に低いため,より大きな利益を達成することができます.
リスクと欠陥
この戦略の最大のリスクは,初期ポジションが限られていることです. 継続的な下落の傾向では,ストップ損失のリスクがあります. そのため,自己負担可能なストップ損失の幅を設定する必要があります.
また,ストップ幅の設定にも同様に二つの極限がある. ストップユニットを過大に設定すると,十分な深さの反発が起きない. ストップ幅を過小に設定すると,中期調整で価格が再停滞して反転する確率は比較的大きい. そのため,異なる市場と自分のリスク好みに応じて適切なストップ幅を選択することが非常に重要です.
DCAの周期が長く,多くの階層が形成された後,価格が大きく上昇した場合,ポジションコストがあまりにも高く,止められないリスクに直面する.これはまた,自分のポジションの総量と最大許容可能なポジションコストに基づいてDCAの階層を合理的に設定する必要がある.
改善の提案
タイミングシグナルを最適化します. 異なるパラメータと異なる指標の組み合わせをテストして,より高い勝利率のシグナルを選択することを期待できます.
最適化ストップ・メカニズム ⇒ シンプルな移動ストップの代わりに Λ型ストップまたは円形ストップを使用してテストすることができ,より良いストップ・効果を得ることができる ⇒ ポジションのタイミングによる戦略調整ストップ幅も加えることができます.
ストップ方式の最適化 異なるタイプの移動ストップをテストして,より優れたストップ出場機会を探し,その結果,全体的な収益率を向上させることができる.
逆転防止メカニズムの加入. 停止後,再びDCA信号を誘発して再びポジションを開く場合がある. このとき,一定の幅の逆転防止範囲の追加を考慮して,停止後すぐにポジションの再激化を避ける.
要約する
この戦略は,RSI指標を用い買い時を判断し,指数関数に基づいて計算された動的止損DCA戦略を用い,ポジション数とポジションコストを動的に調整し,波段市場で価格優位性を獲得する.最適化プログラムは,主に,入出場シグナル,止損と止まりの方法などの側面に焦点を当てている.全体的に,この戦略は,指数DCAの核心心理を用い,ポジションコストを継続的に下げるようにし,清算期間中により多くの動作スペースを得ることができ,トレンドの状況でより高い収益収益を得ることができる.しかし,依然として,自分の資金管理計画に応じて適切なパラメータを選択して,ポジションの全体的なリスクを制御する必要がある.
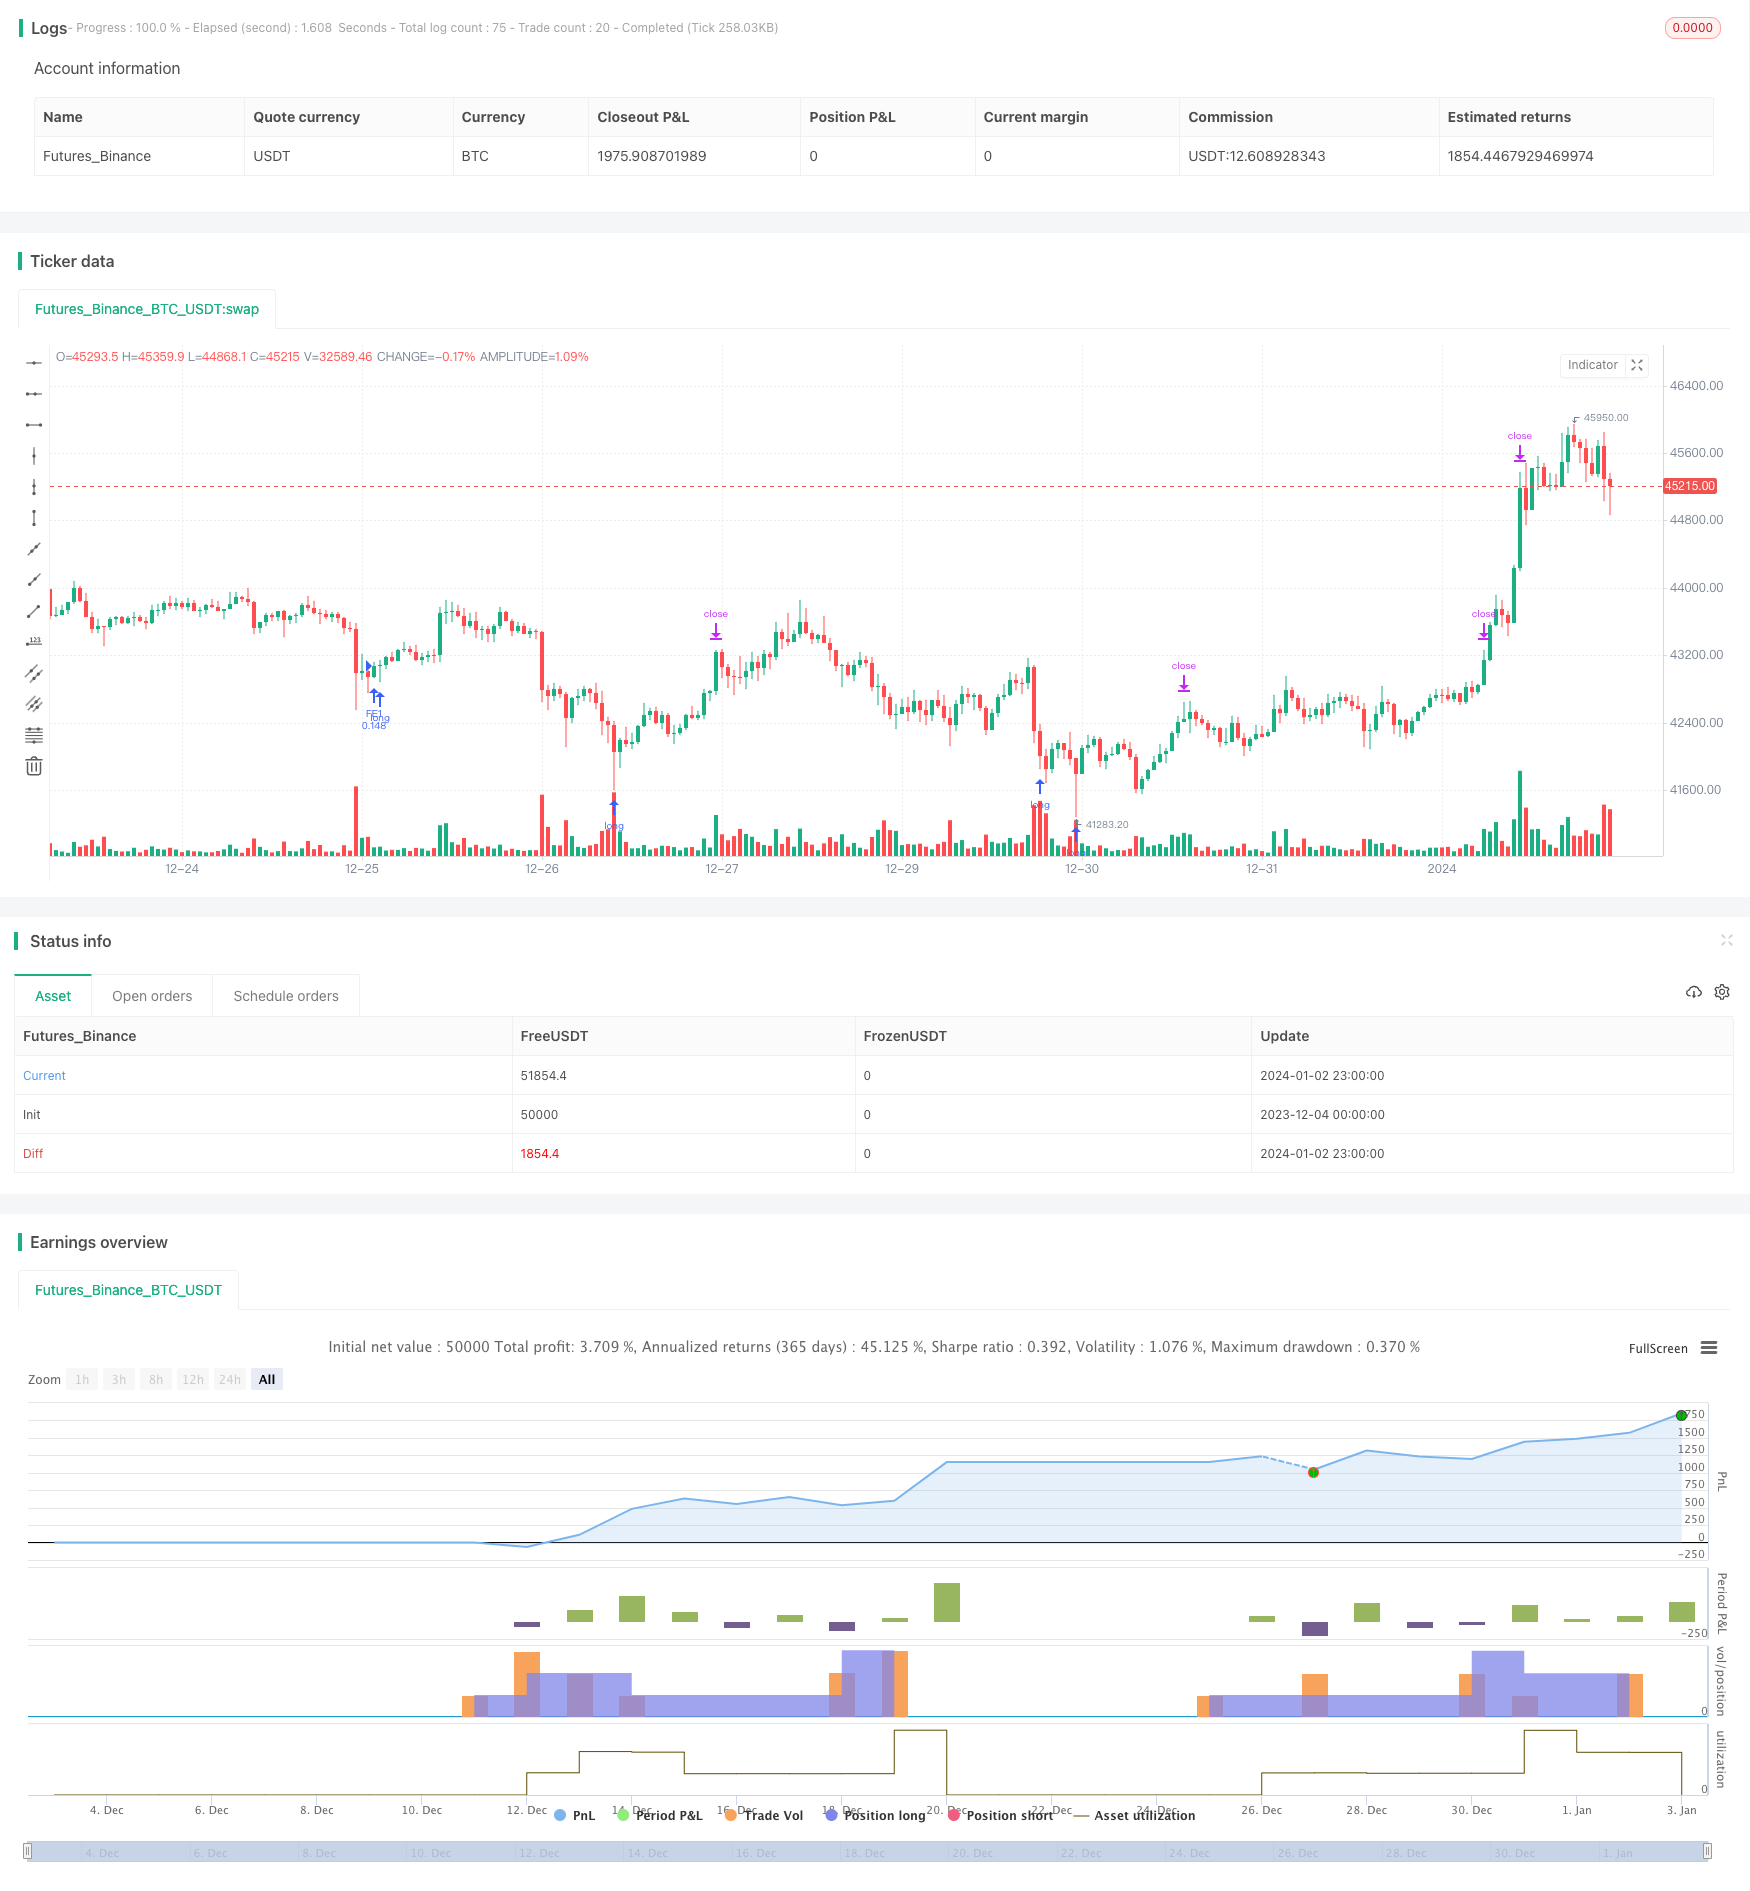
/*backtest
start: 2023-12-04 00:00:00
end: 2024-01-03 00:00:00
period: 1h
basePeriod: 15m
exchanges: [{"eid":"Futures_Binance","currency":"BTC_USDT"}]
*/

// This source code is subject to the terms of the Mozilla Public License 2.0 at https://mozilla.org/MPL/2.0///
// © A3Sh
//@version=5

// Study of a Simple RSI based, PA (priceaveraging) and DCA strategy that opens a new position everytime it hits a specified price level below the first entry.
// The first entry is opened when the specified rsi and moving average conditions are met.
// The following DCA levels are calculated exponentially and set, starting with a specified % of price drop.
// The disctance between the dca levels can be changed with the exponential scale.
// Each position closes individually when it reaches a specified take profit.
// The position can re-open again when it hits the price level again.
// Each time a position is closed and reopened, the average price drops a little.
// The position stays open until the first entry closes or when the price reaches the Stop level.
// When the price reaches the Stop level, all positions will close at once.

// The RSI and MA code for opening the entry is adapted from the Optimized RSI Buy the Dips strategy, by Coinrule.
// This code is used for study purposes, but any other low/ dip finding indicator can be used.
// https://www.tradingview.com/script/Pm1WAtyI-Optimized-RSI-Strategy-Buy-The-Dips-by-Coinrule/

// Dynamic DCA layers are inspired by the Backtesting 3commas DCA Bot v2, by rouxam
// This logic gives more flexibility because you can dyanically change the amount of dca entries.
// https://www.tradingview.com/script/8d6Auyst-Backtesting-3commas-DCA-Bot-v2/

// The use of for loops to (re)open and close different entries separately is based on the Simple_Pyramiding strategy.
// https://www.tradingview.com/script/t6cNLqDN-Simple-Pyramiding/


strategy('Simple_RSI+PA+DCA', overlay=true, pyramiding=20, initial_capital=500, calc_on_order_fills=true, default_qty_type=strategy.percent_of_equity, commission_type=strategy.commission.percent, commission_value=0.075, close_entries_rule='FIFO')

// Backtest Window //
start_time   = input(defval=timestamp("01 April 2021 20:00"), group = "Backtest Window", title="Start Time")
end_time     = input(defval=timestamp("01 Aug 2030 20:00"),   group = "Backtest Window", title="End Time")
window() => true

// Inputs //
takeProfit      = input.float  (3,           group = 'Risk',           title = 'Take Profit %', step=0.1)
takeProfitAll   = input.float  (6,           group = "Risk",           title = 'Close All %',   step=0.1)
posCount        = input.int    (8,           group = 'DCA Settings',   title = 'Max Amount of Entries')
increment       = input.float  (2,           group = 'DCA Settings',   title = 'Price Drop % to open First DCA Order', step=0.5)/100
exponent_scale  = input.float  (1.4,         group = 'DCA Settings',   title = 'Exponential Scale DCA levels', step=0.1, minval=1.1)
bar_lookback    = input.int    (4999,        group = 'DCA Settings',   title = 'Lines Bar Lookback', maxval = 4999)
plotMA          = input.bool   (false,       group = 'Moving Average', title = 'Plot Moving Average')
moving_average  = input.int    (100,         group = 'Moving Average', title = 'MA Length' )
rsiLengthInput  = input.int    (14,          group = 'RSI Settings',   title = "RSI Length", minval=1)
rsiSourceInput  = input.source (close,       group = 'RSI Settings',   title = 'Source')
overSold        = input.int    (29,          group = 'RSI Settings',   title = 'Oversold, Trigger to Enter First Position')

// variables //
var open_position    = true   // true when there are open positions
var entry_price      = 0.0    // the entry price of the first entry
var dca_price        = 0.0    // the price of the different dca layers
var int count        = 0      // bar counter since first open position
var int max_bar      = 0      // max bar buffer variable for DCA lines, stop lines, average price
var line dca_line    = na     // lines variable for creating dca lines

// arrays //
linesArray = array.new_float(posCount,na)  // array to store different dca price levels for creating the dca lines

// Create max bar buffer for DCA lines, Stop and average price lines //
max_bar := count >= bar_lookback ? bar_lookback : count

// Order size based on first entry and amount of DCA layers
q = (strategy.equity  / posCount + 1) / open


// Calculate Moving Averages
movingaverage_signal = ta.sma(close ,moving_average)
plot (plotMA ? movingaverage_signal : na, color = color.new(#f5ff35, 0))


// RSI calculations //
up   = ta.rma(math.max(ta.change(rsiSourceInput), 0), rsiLengthInput)
down = ta.rma(-math.min(ta.change(rsiSourceInput), 0), rsiLengthInput)
rsi  = down == 0 ? 100 : up == 0 ? 0 : 100 - (100 / (1 + up / down))


// Buy Signal (co)
co = ta.crossover(rsi, overSold) and close < movingaverage_signal


// Create a white line for average price, since the last opened position //
// average_price = line.new(x1 = bar_index - max_bar, y1 = strategy.position_avg_price, x2 = bar_index, y2 = strategy.position_avg_price, color = color.white)


// Stop //
// Create a red Stop level line based on a specified % above the average price //
stop_level = strategy.position_avg_price + (strategy.position_avg_price / 100 * takeProfitAll)
// stop_line  = line.new(x1 = bar_index - max_bar, y1 = stop_level, x2 = bar_index, y2 = stop_level, color = color.red)


// Take profit definition per open position //
take_profit_price = close * takeProfit / 100 / syminfo.mintick


// Make sure the Stop level and average price level don't excied the bar buffer to avoid errors //
// if count <= bar_lookback
//     line.set_x1(stop_line,     strategy.opentrades.entry_bar_index(strategy.opentrades - 1))
//     line.set_x1(average_price, strategy.opentrades.entry_bar_index(strategy.opentrades - 1))


// Exponential DCA Layer Calculation fucntion --> First try, needs more experimentation //
dca_price_level(index,entry_price) =>
    entry_price * (1 - (increment * math.pow(exponent_scale, index)))


// Set  Entries //
// Open the first entry and set the entry price //
if co and strategy.position_size == 0 and window()
    open_position := true
    entry_price   := close
    strategy.entry(id = 'FE1', direction = strategy.long, qty = q)

// first_entry_line = line.new(x1 = bar_index - max_bar, y1 = entry_price, x2 = bar_index, y2 = entry_price, color = color.blue)


// Start bar counting since the position is open //
if open_position == true
    count := count + 1


// Set the DCA entries //
// Prices below 1 are not set to avoid negative prices //
if strategy.position_size > 0 and window()
    for i = 0 to strategy.opentrades
        if strategy.opentrades == i and i < posCount
            dca_price := dca_price_level(i,entry_price) > 1 ? dca_price_level(i,entry_price) : na
            entry_id = 'DCA' + str.tostring(i + 1)
            strategy.entry(id = entry_id, direction = strategy.long, limit = dca_price, qty = q)


// Store the values of the different dca price levels in an array and create the dca lines //
// Prices below 1 are not stored//
if open_position==true and window()
    for i = 1 to posCount -1
        array.push(linesArray, dca_price_level(i,entry_price) > 1 ? dca_price_level(i,entry_price) : na)

    // for i = 1 to array.size(linesArray) - 1
    //     dca_line := line.new(x1 = bar_index - max_bar, y1 = array.get(linesArray, i), x2 = bar_index, y2 = array.get(linesArray, i),color = color.blue)


// Create thick line to show the last Entry price //
// last_entry_price = line.new(x1 = bar_index[5], y1 = strategy.opentrades.entry_price(strategy.opentrades - 1), x2 = bar_index, y2 = strategy.opentrades.entry_price(strategy.opentrades - 1),color = color.rgb(255, 0, 204), width = 5)


// Exit the first entry when the take profit triggered //
if strategy.opentrades > 0 and window()
    strategy.exit(id = 'Exit FE', from_entry = 'FE1', profit = take_profit_price)


// Exit DCA entries when take profit is triggered //
if strategy.opentrades > 0 and window()
    for i = 0 to strategy.opentrades
        exit_from = 'DCA' + str.tostring(i + 1)
        exit_id = 'Exit_' + str.tostring(i + 1)
        strategy.exit(id = exit_id, from_entry = exit_from, profit = take_profit_price)


// Close all positions at once when Stop is crossed //
if strategy.opentrades > 0 and ta.crossover(close,stop_level) and window()
    strategy.close_all()


// Make sure nothing is open after alle positions are closed and set the condiftion back to be open for new entries //
if strategy.position_size[1] > 0 and strategy.position_size == 0
    strategy.cancel_all()
    strategy.close_all()
    // line.delete(average_price)
    // line.delete(stop_line)
    // line.delete(dca_line)
    open_position := false   // All position are closed, so back to false
    count := 0               // Reset bar counter