ブレイクアウトとスマートリバーサルボリンジャーバンド価格チャネル戦略
概要
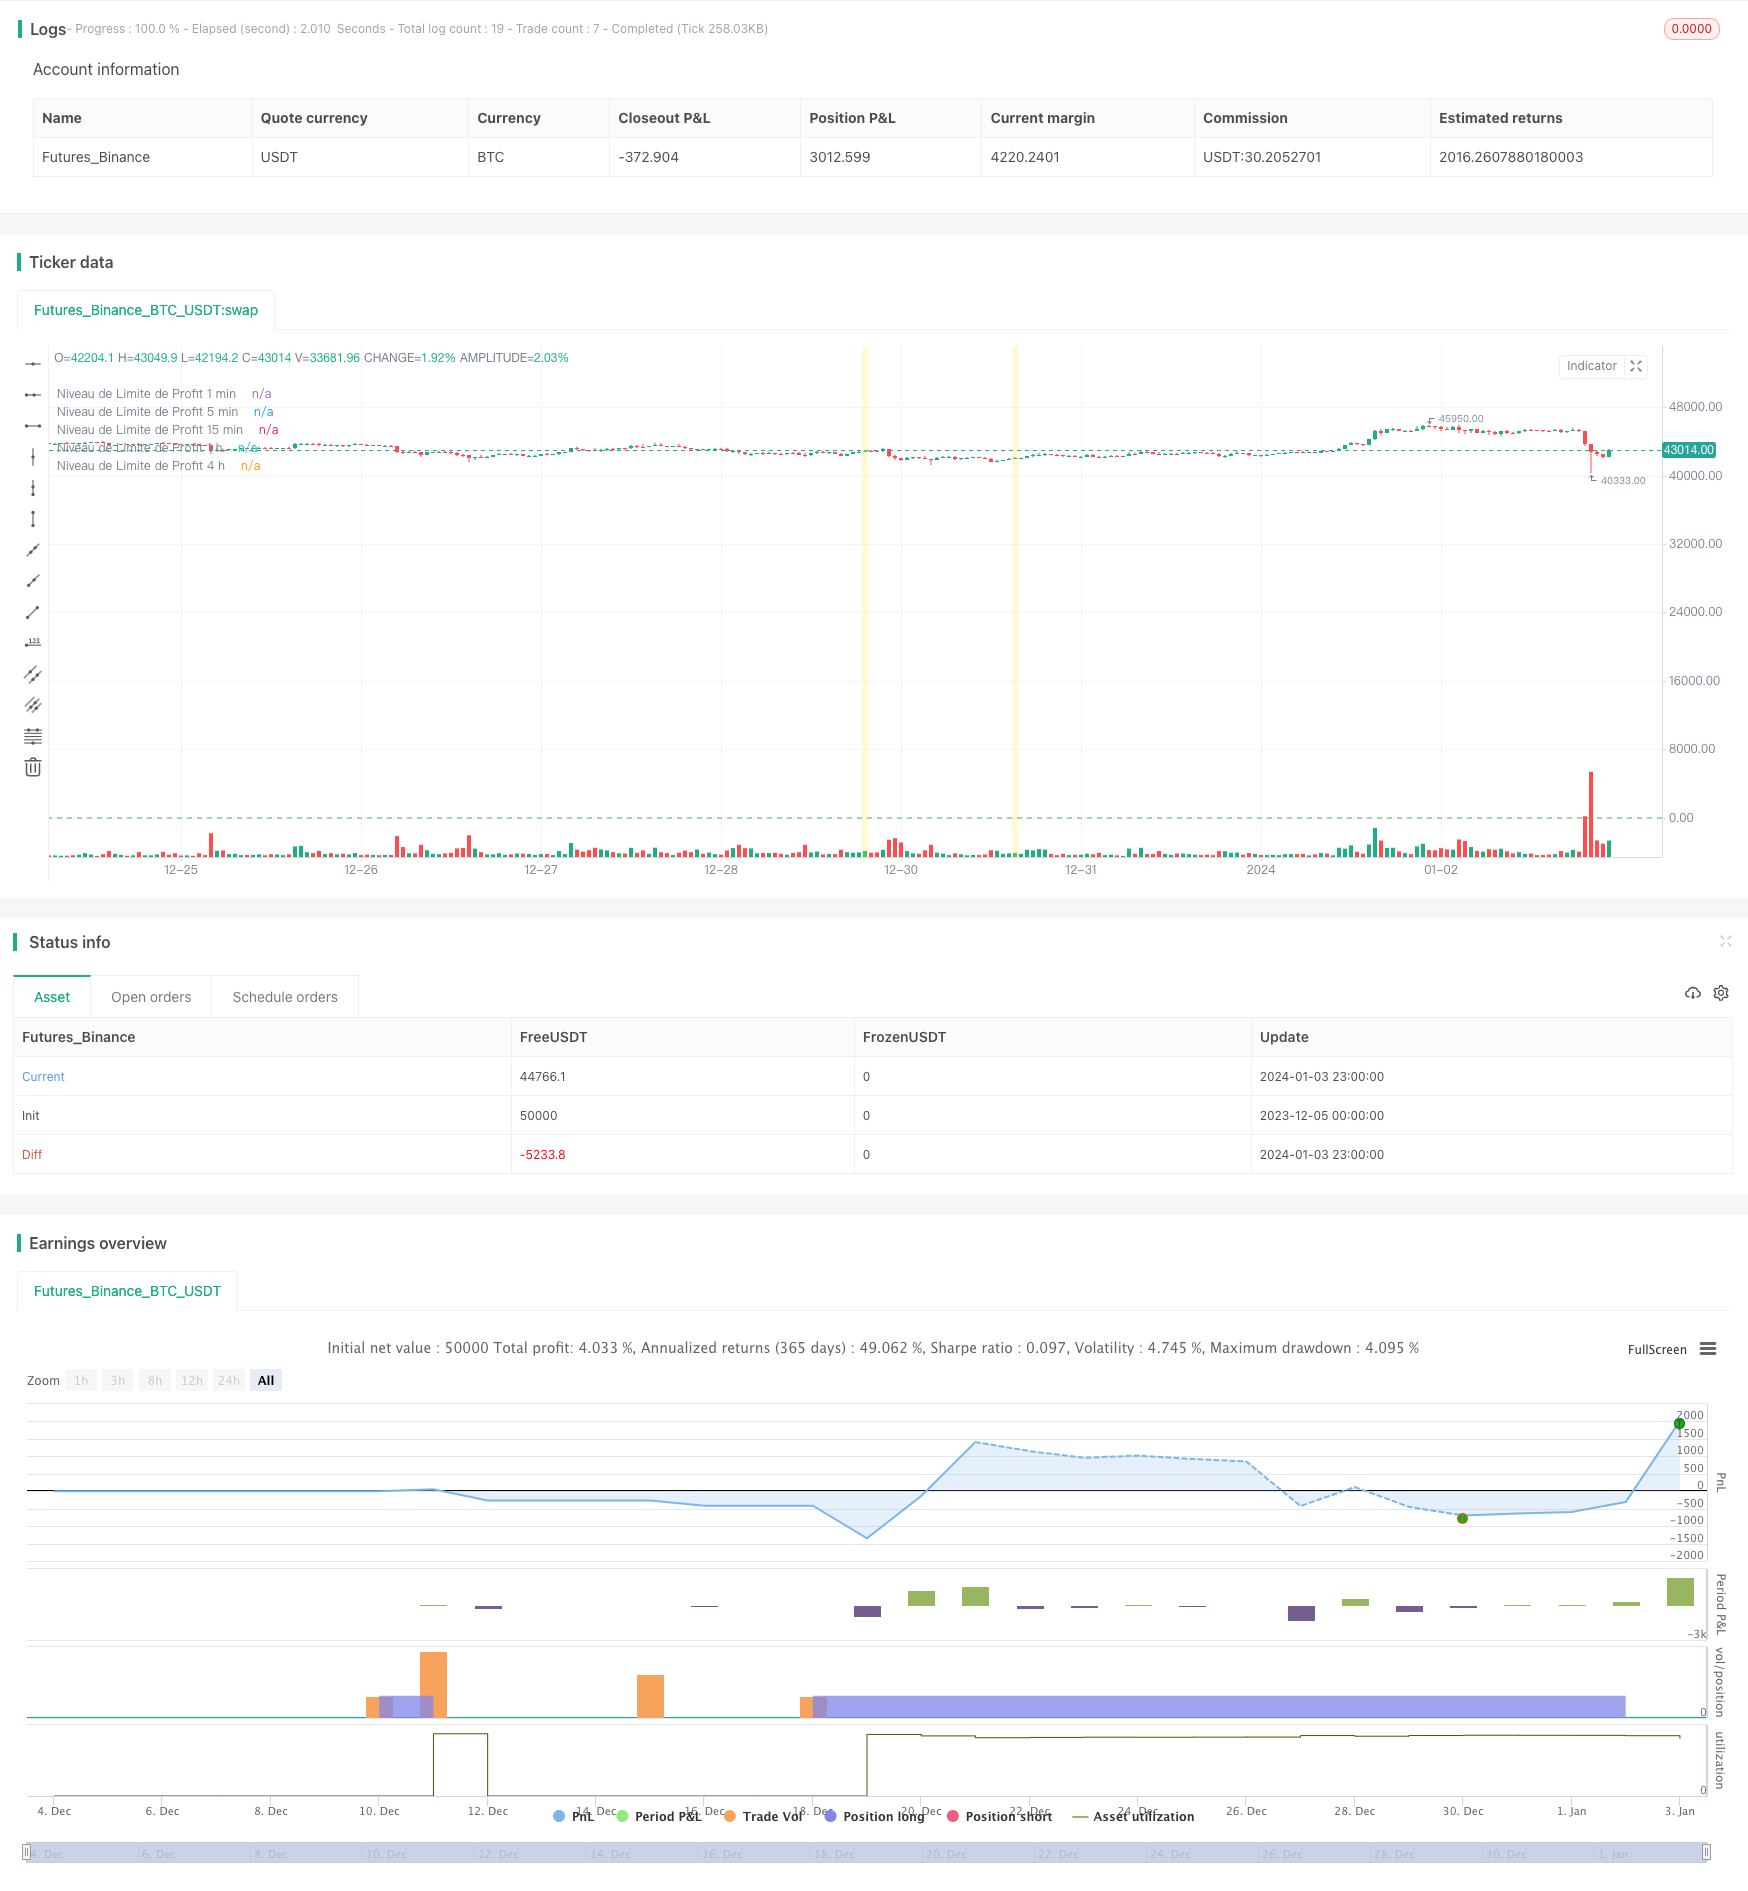
この戦略は,1分,5分,15分,1時間,4時間) の複数の時間帯を組み合わせた突破策で,チャート上のサポートとレジスタンス領域を検出する.
戦略原則
この戦略は,ブリン帯と価格チャネルを使用して,サポートとレジスタンス領域を決定する. まず,それは,上下を決定するために,各時間帯の閉盘価格に基づいて,シンプル・ムービング・アベアンス (SMA) と標準差 (STDEV) を計算します. そして,それは,価格がサポートまたは抵抗レベルから突破した場合と取引量によって決定されるの突破方塊を検出します.
突破ブロックが検出されると,価格が下線を突破した場合,買入シグナルが生じ,上線を突破した場合,売出シグナルが生じます.この戦略は,各時間帯に価格チャネルを図示し,サポートとレジスタンスレベルを示します.
さらに,この戦略は,各時間帯にストップ・ストップの制限レベルを設定している.これは,ポジションに指定された価格レベルは,利益を得るために平定しなければならないことを意味する.同時に,損失を制限するためにストップ・ストップのレベルも設定している.
優位分析
- マルチタイムスケープ分析により,市場動向をより全面的に判断する
- 突破ブロック,ブリン帯通道,取引量との組み合わせにより,信号がより信頼性が高くなります.
- リスク管理に役立つストップ・ストップの設定
リスク分析
- ブリン帯のパラメータが正しく設定されていない場合,偽信号が発生する可能性があります.
- 突破は短期的な市場騒音であり,そのため,封じ込めリスクが生じます.
- 複数の時間帯の判断は戦略の複雑さを増す
ブリン帯のパラメータを最適化して,持仓時間を延長するか,ストップ・ロスを設定することで,さらなるリスクを回避することができる.
最適化の方向
この戦略は以下の点で最適化できます.
ブリン帯のパラメータを最適化して,上下線が実際のサポートとレジスタンスをよりよく反映させる
機械学習のアルゴリズムを導入し,突破の方向と強さを判断する
株価変動指数を増やして,最適な時を判断する.
MACD,KDなどの指標を組み合わせて 傾向とエネルギーを判断します
要約する
この戦略は,複数の時間範囲の技術指標分析を統合し,突破取引,ストップ・ストップ・損失管理によるリスクを,柔軟で信頼性の高い突破システム取引戦略である.しかし,パラメータ設定とリスク管理は,実際の市場に基づいて継続的にテストされ,最適化する必要があります.
/*backtest
start: 2023-12-05 00:00:00
end: 2024-01-04 00:00:00
period: 1h
basePeriod: 15m
exchanges: [{"eid":"Futures_Binance","currency":"BTC_USDT"}]
*/

//@version=5
strategy("DZ Strategy ICT", overlay=true)

// Paramètres de l'indicateur
length1 = input.int(14, minval=1, title='Longueur 1 min')
deviations1 = input.float(2.0, title='Déviations 1 min')
multiplier1 = input.float(1.0, minval=0.1, maxval=10, title='Multiplicateur 1 min')
fibonacciLevel1 = input.float(0.618, title='Niveau de Fibonacci 1 min')
displacement1 = input.int(3, minval=1, title='Décalage de Displacement 1 min')
volumeThreshold1 = input.float(1.0, minval=0, title='Seuil de Volume 1 min')
fibLevelInput1 = input.float(0.0, "Niveau de Limite de Profit 1 min", minval=0.0)

length5 = input.int(14, minval=1, title='Longueur 5 min')
deviations5 = input.float(2.0, title='Déviations 5 min')
multiplier5 = input.float(1.0, minval=0.1, maxval=10, title='Multiplicateur 5 min')
fibonacciLevel5 = input.float(0.618, title='Niveau de Fibonacci 5 min')
displacement5 = input.int(3, minval=1, title='Décalage de Displacement 5 min')
volumeThreshold5 = input.float(1.0, minval=0, title='Seuil de Volume 5 min')
fibLevelInput5 = input.float(0.0, "Niveau de Limite de Profit 5 min", minval=0.0)

length15 = input.int(14, minval=1, title='Longueur 15 min')
deviations15 = input.float(2.0, title='Déviations 15 min')
multiplier15 = input.float(1.0, minval=0.1, maxval=10, title='Multiplicateur 15 min')
fibonacciLevel15 = input.float(0.618, title='Niveau de Fibonacci 15 min')
displacement15 = input.int(3, minval=1, title='Décalage de Displacement 15 min')
volumeThreshold15 = input.float(1.0, minval=0, title='Seuil de Volume 15 min')
fibLevelInput15 = input.float(0.0, "Niveau de Limite de Profit 15 min", minval=0.0)

length60 = input.int(14, minval=1, title='Longueur 1 h')
deviations60 = input.float(2.0, title='Déviations 1 h')
multiplier60 = input.float(1.0, minval=0.1, maxval=10, title='Multiplicateur 1 h')
fibonacciLevel60 = input.float(0.618, title='Niveau de Fibonacci 1 h')
displacement60 = input.int(3, minval=1, title='Décalage de Displacement 1 h')
volumeThreshold60 = input.float(1.0, minval=0, title='Seuil de Volume 1 h')
fibLevelInput60 = input.float(0.0, "Niveau de Limite de Profit 1 h", minval=0.0)

length240 = input.int(14, minval=1, title='Longueur 4 h')
deviations240 = input.float(2.0, title='Déviations 4 h')
multiplier240 = input.float(1.0, minval=0.1, maxval=10, title='Multiplicateur 4 h')
fibonacciLevel240 = input.float(0.618, title='Niveau de Fibonacci 4 h')
displacement240 = input.int(3, minval=1, title='Décalage de Displacement 4 h')
volumeThreshold240 = input.float(1.0, minval=0, title='Seuil de Volume 4 h')
fibLevelInput240 = input.float(0.0, "Niveau de Limite de Profit 4 h", minval=0.0)

// Calcul des supports et résistances pour chaque plage de temps
basis1 = ta.sma(close, length1)
range_1 = multiplier1 * ta.stdev(close, length1)
upper1 = basis1 + deviations1 * range_1
lower1 = basis1 - deviations1 * range_1

basis5 = ta.sma(close, length5)
range_5 = multiplier5 * ta.stdev(close, length5)
upper5 = basis5 + deviations5 * range_5
lower5 = basis5 - deviations5 * range_5

basis15 = ta.sma(close, length15)
range_15 = multiplier15 * ta.stdev(close, length15)
upper15 = basis15 + deviations15 * range_15
lower15 = basis15 - deviations15 * range_15

basis60 = ta.sma(close, length60)
range_60 = multiplier60 * ta.stdev(close, length60)
upper60 = basis60 + deviations60 * range_60
lower60 = basis60 - deviations60 * range_60

basis240 = ta.sma(close, length240)
range_240 = multiplier240 * ta.stdev(close, length240)
upper240 = basis240 + deviations240 * range_240
lower240 = basis240 - deviations240 * range_240

// Calcul du volume moyen sur chaque période donnée
averageVolume1 = ta.sma(volume, length1)
averageVolume5 = ta.sma(volume, length5)
averageVolume15 = ta.sma(volume, length15)
averageVolume60 = ta.sma(volume, length60)
averageVolume240 = ta.sma(volume, length240)

// Détection du Breaker Block en fonction du déplacement et du volume pour chaque plage de temps
breakerBlock1 = ta.crossover(close[displacement1], lower1) and volume > volumeThreshold1 * averageVolume1
breakerBlock1 := breakerBlock1 or (ta.crossunder(close[displacement1], upper1) and volume > volumeThreshold1 * averageVolume1)

breakerBlock5 = ta.crossover(close[displacement5], lower5) and volume > volumeThreshold5 * averageVolume5
breakerBlock5 := breakerBlock5 or (ta.crossunder(close[displacement5], upper5) and volume > volumeThreshold5 * averageVolume5)

breakerBlock15 = ta.crossover(close[displacement15], lower15) and volume > volumeThreshold15 * averageVolume15
breakerBlock15 := breakerBlock15 or (ta.crossunder(close[displacement15], upper15) and volume > volumeThreshold15 * averageVolume15)

breakerBlock60 = ta.crossover(close[displacement60], lower60) and volume > volumeThreshold60 * averageVolume60
breakerBlock60 := breakerBlock60 or (ta.crossunder(close[displacement60], upper60) and volume > volumeThreshold60 * averageVolume60)

breakerBlock240 = ta.crossover(close[displacement240], lower240) and volume > volumeThreshold240 * averageVolume240
breakerBlock240 := breakerBlock240 or (ta.crossunder(close[displacement240], upper240) and volume > volumeThreshold240 * averageVolume240)

// Affichage du Breaker Block sur le graphique
bgcolor(breakerBlock1 ? color.new(color.yellow, 70) : na)
bgcolor(breakerBlock5 ? color.new(color.yellow, 70) : na)
bgcolor(breakerBlock15 ? color.new(color.yellow, 70) : na)
bgcolor(breakerBlock60 ? color.new(color.yellow, 70) : na)
bgcolor(breakerBlock240 ? color.new(color.yellow, 70) : na)

// Définition de la zone limite de l'ordre de profit pour chaque plage de temps
fibLevel1 = basis1 * fibonacciLevel1
fibLevel5 = basis5 * fibonacciLevel5
fibLevel15 = basis15 * fibonacciLevel15
fibLevel60 = basis60 * fibonacciLevel60
fibLevel240 = basis240 * fibonacciLevel240

// Signal d'achat modifié en fonction du Breaker Block et du déplacement pour chaque plage de temps
buySignal1 = ta.crossover(close[displacement1], lower1) and volume > volumeThreshold1 * averageVolume1
buySignal5 = ta.crossover(close[displacement5], lower5) and volume > volumeThreshold5 * averageVolume5
buySignal15 = ta.crossover(close[displacement15], lower15) and volume > volumeThreshold15 * averageVolume15
buySignal60 = ta.crossover(close[displacement60], lower60) and volume > volumeThreshold60 * averageVolume60
buySignal240 = ta.crossover(close[displacement240], lower240) and volume > volumeThreshold240 * averageVolume240

// Signal de vente modifié en fonction du Breaker Block et du déplacement pour chaque plage de temps
sellSignal1 = ta.crossunder(close[displacement1], upper1) and volume > volumeThreshold1 * averageVolume1
sellSignal5 = ta.crossunder(close[displacement5], upper5) and volume > volumeThreshold5 * averageVolume5
sellSignal15 = ta.crossunder(close[displacement15], upper15) and volume > volumeThreshold15 * averageVolume15
sellSignal60 = ta.crossunder(close[displacement60], upper60) and volume > volumeThreshold60 * averageVolume60
sellSignal240 = ta.crossunder(close[displacement240], upper240) and volume > volumeThreshold240 * averageVolume240


// Tracé des niveaux de limite de profit pour chaque plage de temps
hline(fibLevelInput1, color=color.green, linestyle=hline.style_dashed, title="Niveau de Limite de Profit 1 min")
hline(fibLevelInput5, color=color.green, linestyle=hline.style_dashed, title="Niveau de Limite de Profit 5 min")
hline(fibLevelInput15, color=color.green, linestyle=hline.style_dashed, title="Niveau de Limite de Profit 15 min")
hline(fibLevelInput60, color=color.green, linestyle=hline.style_dashed, title="Niveau de Limite de Profit 1 h")
hline(fibLevelInput240, color=color.green, linestyle=hline.style_dashed, title="Niveau de Limite de Profit 4 h")

// Définition des ordres de vente et d'achat pour chaque plage de temps
if buySignal1
    strategy.entry("Achat 1 min", strategy.long)

if sellSignal1
    strategy.entry("Vente 1 min", strategy.short)

if buySignal5
    strategy.entry("Achat 5 min", strategy.long)

if sellSignal5
    strategy.entry("Vente 5 min", strategy.short)

if buySignal15
    strategy.entry("Achat 15 min", strategy.long)

if sellSignal15
    strategy.entry("Vente 15 min", strategy.short)

if buySignal60
    strategy.entry("Achat 1 h", strategy.long)

if sellSignal60
    strategy.entry("Vente 1 h", strategy.short)

if buySignal240
    strategy.entry("Achat 4 h", strategy.long)

if sellSignal240
    strategy.entry("Vente 4 h", strategy.short)

// Configuration des ordres de sortie (Take Profit) pour chaque plage de temps
profitRatio = 2
stopLossRatio = 1

stopLossLevel1 = strategy.position_avg_price * (1 - stopLossRatio / (stopLossRatio + profitRatio))
stopLossLevel5 = strategy.position_avg_price * (1 - stopLossRatio / (stopLossRatio + profitRatio))
stopLossLevel15 = strategy.position_avg_price * (1 - stopLossRatio / (stopLossRatio + profitRatio))
stopLossLevel60 = strategy.position_avg_price * (1 - stopLossRatio / (stopLossRatio + profitRatio))
stopLossLevel240 = strategy.position_avg_price * (1 - stopLossRatio / (stopLossRatio + profitRatio))

strategy.exit("Stop Loss 1 min", "Achat 1 min", stop=stopLossLevel1)
strategy.exit("Stop Loss 1 min", "Vente 1 min", stop=stopLossLevel1)

strategy.exit("Stop Loss 5 min", "Achat 5 min", stop=stopLossLevel5)
strategy.exit("Stop Loss 5 min", "Vente 5 min", stop=stopLossLevel5)

strategy.exit("Stop Loss 15 min", "Achat 15 min", stop=stopLossLevel15)
strategy.exit("Stop Loss 15 min", "Vente 15 min", stop=stopLossLevel15)

strategy.exit("Stop Loss 1 h", "Achat 1 h", stop=stopLossLevel60)
strategy.exit("Stop Loss 1 h", "Vente 1 h", stop=stopLossLevel60)