適応型トレンドフォロー戦略
概要
自己適応トレンドフォロー戦略は,ブリン帯指標と均線指標を組み合わせ,動的にトレンド強度因子を調整し,トレンドフォローとストロップを実現する量化取引戦略である. この戦略は,ブリン帯指標を使用して価格変動率を計算し,その動態に基づいて合理的なトレンド強さを計算し,その後ATR指標と組み合わせて自己適応トレンドチャネルを図り,牛熊トレンドの判断とフォローを実現する. 同時に,戦略の内置のストロップ・メカニズムは,リスクを効果的に制御する.
戦略原則
この戦略の核心指標はブリン帯である。ブリン帯は中軌,上軌,下軌から構成されている。中軌はn日の単純移動平均で,上軌は中軌+k倍のn日の標準差で,下軌は中軌-k倍のn日の標準差である。ここでは20日間の中軌と2倍の標準差を選んでブリン帯を構成している。
ブリン帯の帯域 (上線-下線) と中線の比率を計算し,強度因数と呼ぶ.この比率は,現在の市場変動率とトレンドの強さを反映する.強度因子の最大最小値を設定し,過大または過小にならないようにする.
合理的な強度因子を得て,ATR指数と組み合わせて,上下線をそれぞれ上下移動するATR*強度因子という距離は,自己適応のトレンドチャネルを形成する。閉盤価格が下から上へ突破する時は,多めにする;上から下へ突破する時は,空いてする。
さらに,戦略は,多頭ポジションが形成された後に,価格が開設時の最低点を下回った場合,平頭ポジションを停止する.空頭ポジションも同様である.
戦略的優位性
この戦略の利点は以下の通りです.
適応力強.強度因子の計算方法により,戦略は市場変動率の動向に応じてチャネル幅を調整し,トレンド牛市ではチャネルを広げ,震動市場ではチャネルを狭め,異なるタイプの市場に自律的に適応することができます.
操作頻度は適度である。 単純移動平均策と比較して,ブリン帯策はチャネルを調整する頻度は低いため,不必要な頻繁に平仓を回避する。
入場は正確である。上下線を突破するこの入場は,市場騒音を効果的にフィルターし,トレンドの開幕を高い確率で捕捉することを保証する。
ストップ・メカニズムがある. ストップ・メカニズムの内蔵は,単一の損失を効果的に制御する,この戦略の大きな利点である.
戦略リスク
この戦略にはいくつかのリスクがあります.
参数感度が高い.ブリン帯の周期nと倍数kが結果に影響を及ぼし,最適な参数組み合わせを見つけるために繰り返しテストが必要である.
ブリン帯の軌道は散布時にトレンドを追跡することができない.価格が激しく波動すると,ブリン帯の軌道は素早く引き離され,トレンドを追跡することができない.このとき,戦略を一時停止し,軌道の収束後に再稼働させる必要がある.
ブルリン帯の戦略は完璧ではないので,一定の誤信号が生じるので,それに応じて損失を負う必要がある.
ストップは比較的シンプルである.この戦略のストップは,ポジション開設後の最高価格と最低価格のみを考慮し,波動率などのより複雑なストップは加えられず,過度に激進的または保守的であり,最適化が必要である.
戦略最適化の方向性
この戦略は,以下の点で改善する必要がある:
異なる通貨と異なる周期のパラメータの効果をテストする. 戦略のパラメータは,異なる通貨と周期に対して最適化され,戦略の適応性を向上させる.
損失停止機構の最適化.移動停止,振動停止,追跡停止などを導入して,損失停止方法をより賢くすることができる.
他の指標と組み合わせてフィルタリングする. MACD,KDJなどの指標を追加して,ブリン帯が横盤振動市場で誤信号を生じさせないようにする.
ポジション管理の仕組みを増やす. ストップ,ピラミッド加仓,固定比率ポジションなどの管理方法を実現することで,戦略の収益率を向上させることができる.
回測最適化を行う.回測時間範囲を拡大し,パラメータを調整し,回測レポートを分析するなど,戦略の効果を全面的に検証し,最適パラメータを見つける.
要約する
自動適応トレンドは,戦略全体としてより成熟した量化戦略である.ブルリン帯の指標の動的捕捉トレンドを適用し,ATR指標と連携して自己適応チャネルを構築し,多空トレンドの判断を実現する.同時に,内蔵の止損メカニズムによるリスク制御.この戦略の優点は,動作頻度が適度で,入場精度,リスク管理性が優れている.しかし,いくつかの問題があり,参数選択数,止損方法,信号フィルターなどの面で最適化する必要があり,戦略をより堅実でスマートにします.
/*backtest
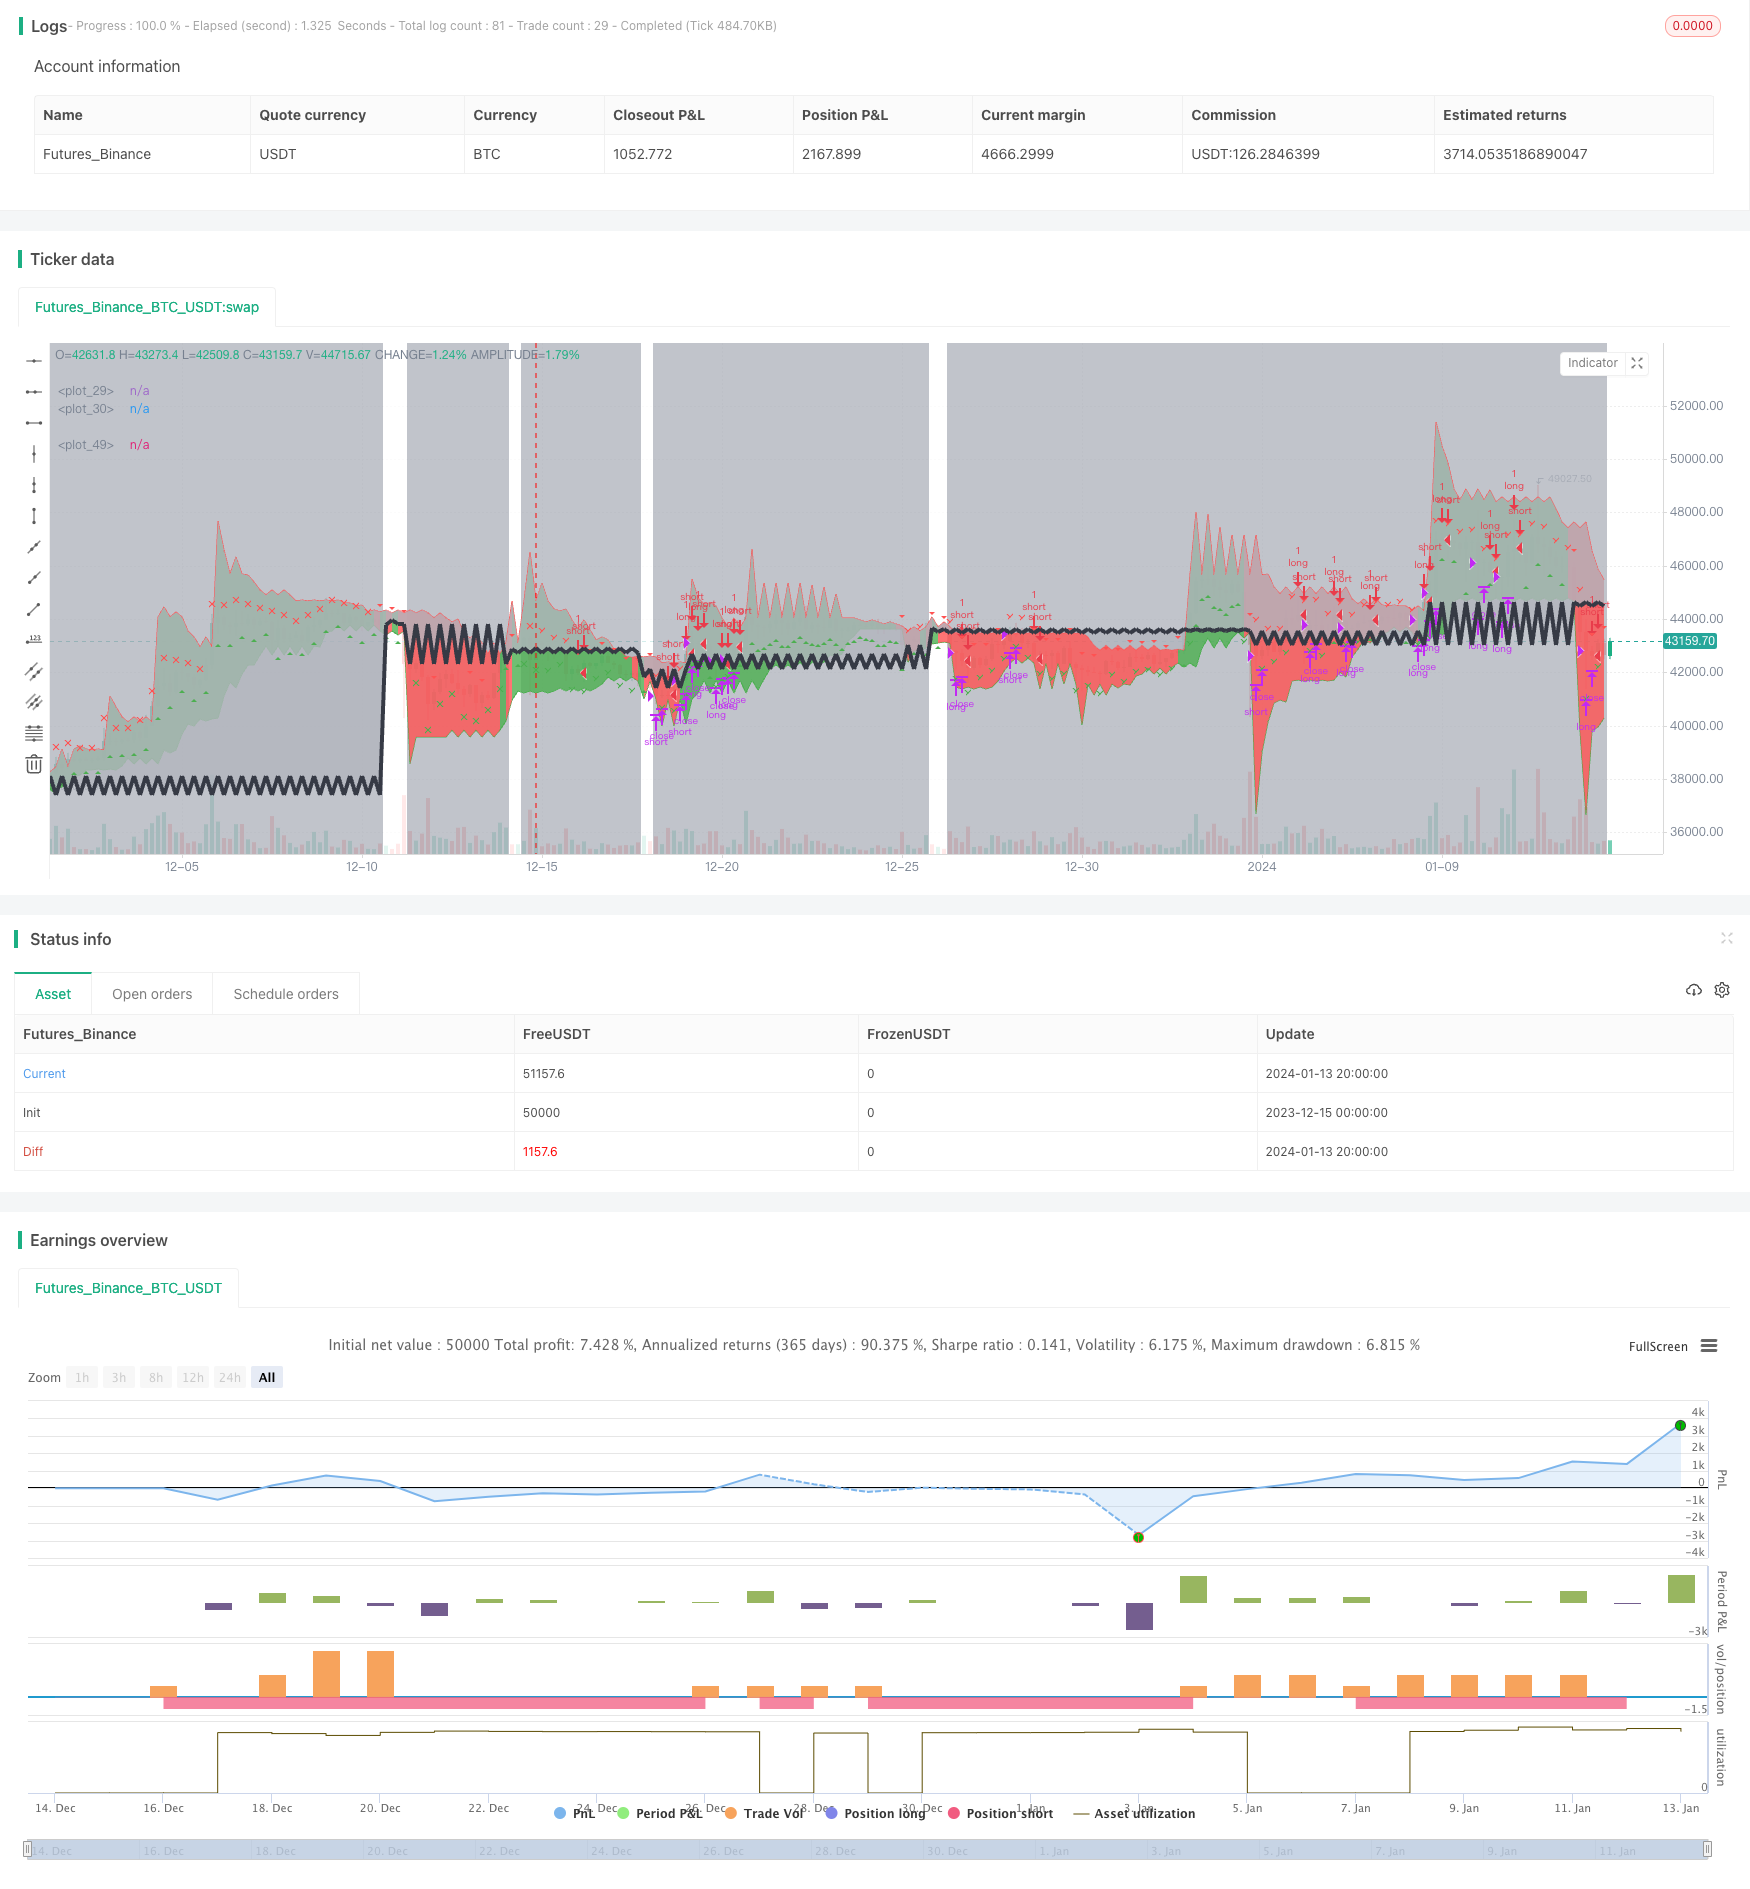
start: 2023-12-15 00:00:00
end: 2024-01-14 00:00:00
period: 4h
basePeriod: 15m
exchanges: [{"eid":"Futures_Binance","currency":"BTC_USDT"}]
*/
//@version=2
strategy("[Th] Adaptive Trend v1", shorttitle="[TH] Adaptive Trend", overlay=true)
Pd=input(2, minval=1,maxval = 100, title="Period")
Bw=input(50, minval=1,maxval = 100, title="Bandwidth")
minFactor = input(0.5, minval=0.1, maxval=1.0, step=0.1, title="Minimum Factor")
maxFactor = input(3.00, minval=0.2, maxval=5.0, step=0.1, title="Maximum Factor")
plot_trend=input(true, title="Plot trend")
plot_losscut = input(true, title="Plot losscut")
/////////////// Calculate the BB's ///////////////
basisBB = ema(close, 20)
devBB = 2 * stdev(close, 20)
upperBB = basisBB + devBB
lowerBB = basisBB - devBB
//plot(upperBB)
//plot(lowerBB)
///////////// Trend ////////////////////////////
rawFactor = ((upperBB-lowerBB)/basisBB)*Bw
Factor = rawFactor > minFactor ? (rawFactor > maxFactor ? maxFactor : rawFactor) : minFactor
Up=hl2-(Factor*atr(Pd))
Dn=hl2+(Factor*atr(Pd))
TrendUp=close[1]>TrendUp[1]? max(Up,TrendUp[1]) : Up
TrendDown=close[1]<TrendDown[1]? min(Dn,TrendDown[1]) : Dn
TrendUpPlot=plot(plot_trend?TrendUp:na, style=line, color=green, linewidth=1)
TrendDownPlot=plot(plot_trend?TrendDown:na, style=line, color=red, linewidth=1)
Trend = close > TrendDown[1] ? 1: close< TrendUp[1]? -1: nz(Trend[1],1)
fill(TrendUpPlot,TrendDownPlot, color=Trend == 1 ? green : red, transp=80)
sig_trend_long = Trend[1] == -1 and Trend == 1
sig_trend_short = Trend[1] == 1 and Trend == -1
///////////// Loss Cut ////////////////////////////
price_cut = sig_trend_long[1] or sig_trend_short[1] or sig_reentry_long[1] or sig_reentry_short[1] ? open : price_cut[1]
current_trend = sig_trend_long[1] ? 1 : (sig_trend_short[1] ? -1 : current_trend[1])
sig_loss_cut = sig_trend_long or sig_trend_short ? false : ( current_trend == 1 ? (price_cut > low) : (current_trend == -1 ? (price_cut < high) : false) )
has_position = sig_loss_cut ? false : ((sig_trend_long[1] or sig_trend_short[1] or sig_reentry_long[1] or sig_reentry_short[1]) ? true : has_position[1])
sig_reentry_long = not has_position and current_trend == 1 and low > price_cut
sig_reentry_short = not has_position and current_trend == -1 and high < price_cut
bgcolor(plot_losscut and ( not has_position or sig_loss_cut ) ? silver : white, transp=70)
plotshape(plot_losscut and sig_loss_cut and current_trend == 1? 1 : na, color=green, style=shape.xcross, location=location.belowbar ,size=size.tiny)
plotshape(plot_losscut and sig_loss_cut and current_trend == -1? 1 : na, color=red, style=shape.xcross, location=location.abovebar ,size=size.tiny)
LossCutPlot = plot(plot_losscut ? price_cut : na, linewidth=4, color=black, transp=60)
fill(TrendDownPlot, LossCutPlot, color=silver, transp=90)
plotshape(sig_trend_long or sig_reentry_long ? Trend : na, title="Up Entry Arrow", color=green, style=shape.triangleup, location=location.belowbar, size=size.tiny)
plotshape(sig_trend_short or sig_reentry_short ? Trend : na, title="Down Entry Arrow",color=red, style=shape.triangledown, size=size.tiny)
///////////// Strategy ////////////////////////////
if true
strategy.entry('long', long=strategy.long, comment='Long', when=sig_trend_long or sig_reentry_long)
strategy.entry('short', long=strategy.short, comment='Short', when=sig_trend_short or sig_reentry_short)
if(current_trend == 1)
strategy.close('long', when=sig_loss_cut == true)
//strategy.exit('lc',from_entry='long', stop=price_cut)
if( current_trend == -1 )
strategy.close('short', when=sig_loss_cut == true)
//strategy.exit('sc',from_entry='short', stop=price_cut)