ADXモメンタムトレンド戦略

1
Follow
1802
Followers
概要
本戦略は、ADXインジケーターに基づいて市場トレンドを判断し、DMIインジケーターと組み合わせて買い・売りの方向性を判断します。ADXの傾きを利用してトレンドの強さを評価し、ADXの閾値を設定して非トレンド市場をフィルタリングし、移動平均線を補助的に用いて取引シグナルをフィルタリングします。
戦略の原理
- ADX、DI+、DI-インジケーターを計算します。
- ADXの傾き>0はトレンドが強まっていることを示します。閾値は23に設定し、非トレンド市場をフィルタリングします。
- DI+がDI-より高い場合、買い勢力が売り勢力より強いことを示し、買いシグナルとなります。
- 移動平均線によるフィルタリングを有効にした場合、終値が移動平均線より高い場合のみ、買いシグナルが発生します。
- ADXの傾き<0の場合、ポジションをクローズします。これはトレンドが弱まったことを示します。
優位性分析
- MAフィルタリングにより、非トレンド市場におけるノイズ取引を低減できます。
- ADXの傾きでトレンドの強さを判断することで、トレンドの発展を正確に評価できます。
- DIによる方向判断とADXによる強さ判断を組み合わせることで、より完全なトレンドフォロー戦略の意思決定体系を構築できます。
- ドローダウンとリスクリワード比は、単純な移動平均線戦略よりも優れている可能性があります。
リスク分析
- ADXインジケーターのパラメーター設定によって結果が大きく異なります。
- DMIが買い・売りの方向性を完全に確定する前に、誤ったシグナルを発する可能性があります。
- 一定の遅延が存在し、戦略の効率を低下させます。
最適化の方向性
- ADXのパラメーター組み合わせを最適化し、最適なパラメーターを探索します。
- ストップロス戦略を追加し、単一取引の損失拡大を防ぎます。
- 他のインジケーターと組み合わせてシグナルをフィルタリングすることを試みます。例:RSI、ボリンジャーバンド。
まとめ
本戦略は、ADXを利用してトレンドとその強さを判断する利点を最大限に活用し、DMIインジケーターと組み合わせて方向性を判断することで、完全なトレンドフォローシステムを形成します。同時に、移動平均線を補助的に使用することで、非トレンド市場のノイズを効果的にフィルタリングできます。パラメーターの最適化やインジケーターの組み合わせにより、戦略の安定性と効率をさらに向上させることが可能です。総じて、本戦略はトレンド判断と方向判断の特性を組み合わせており、良好なリターンが期待できます。
Source
Pine
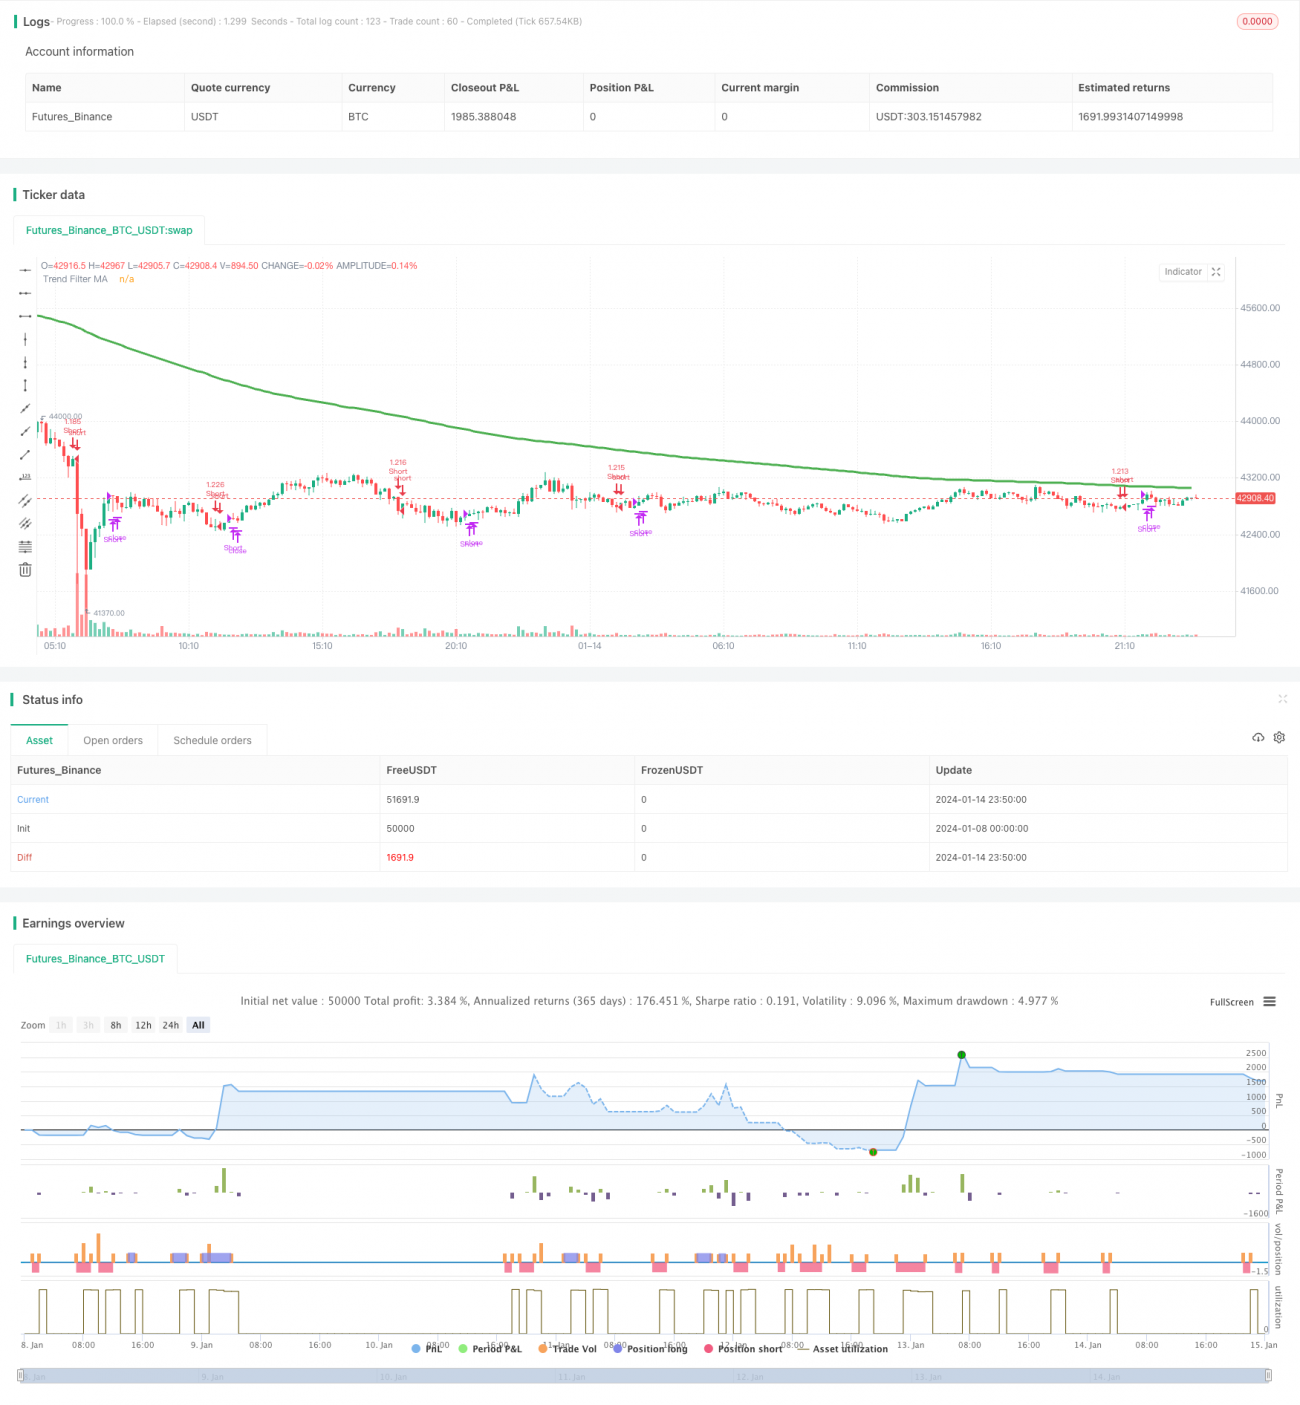
/*backtest
start: 2024-01-08 00:00:00
end: 2024-01-15 00:00:00
period: 10m
basePeriod: 1m
exchanges: [{"eid":"Futures_Binance","currency":"BTC_USDT"}]
*/

//@version=4
// This source code is subject to the terms of the Mozilla Public License 2.0 at https://mozilla.org/MPL/2.0/
// © millerrh with inspiration from @9e52f12edd034d28bdd5544e7ff92e
//The intent behind this study is to look at ADX when it has an increasing slope and is above a user-defined key level (23 default). Strategy parameters
Related strategies
Comment
All comments (0)
No data
- 1