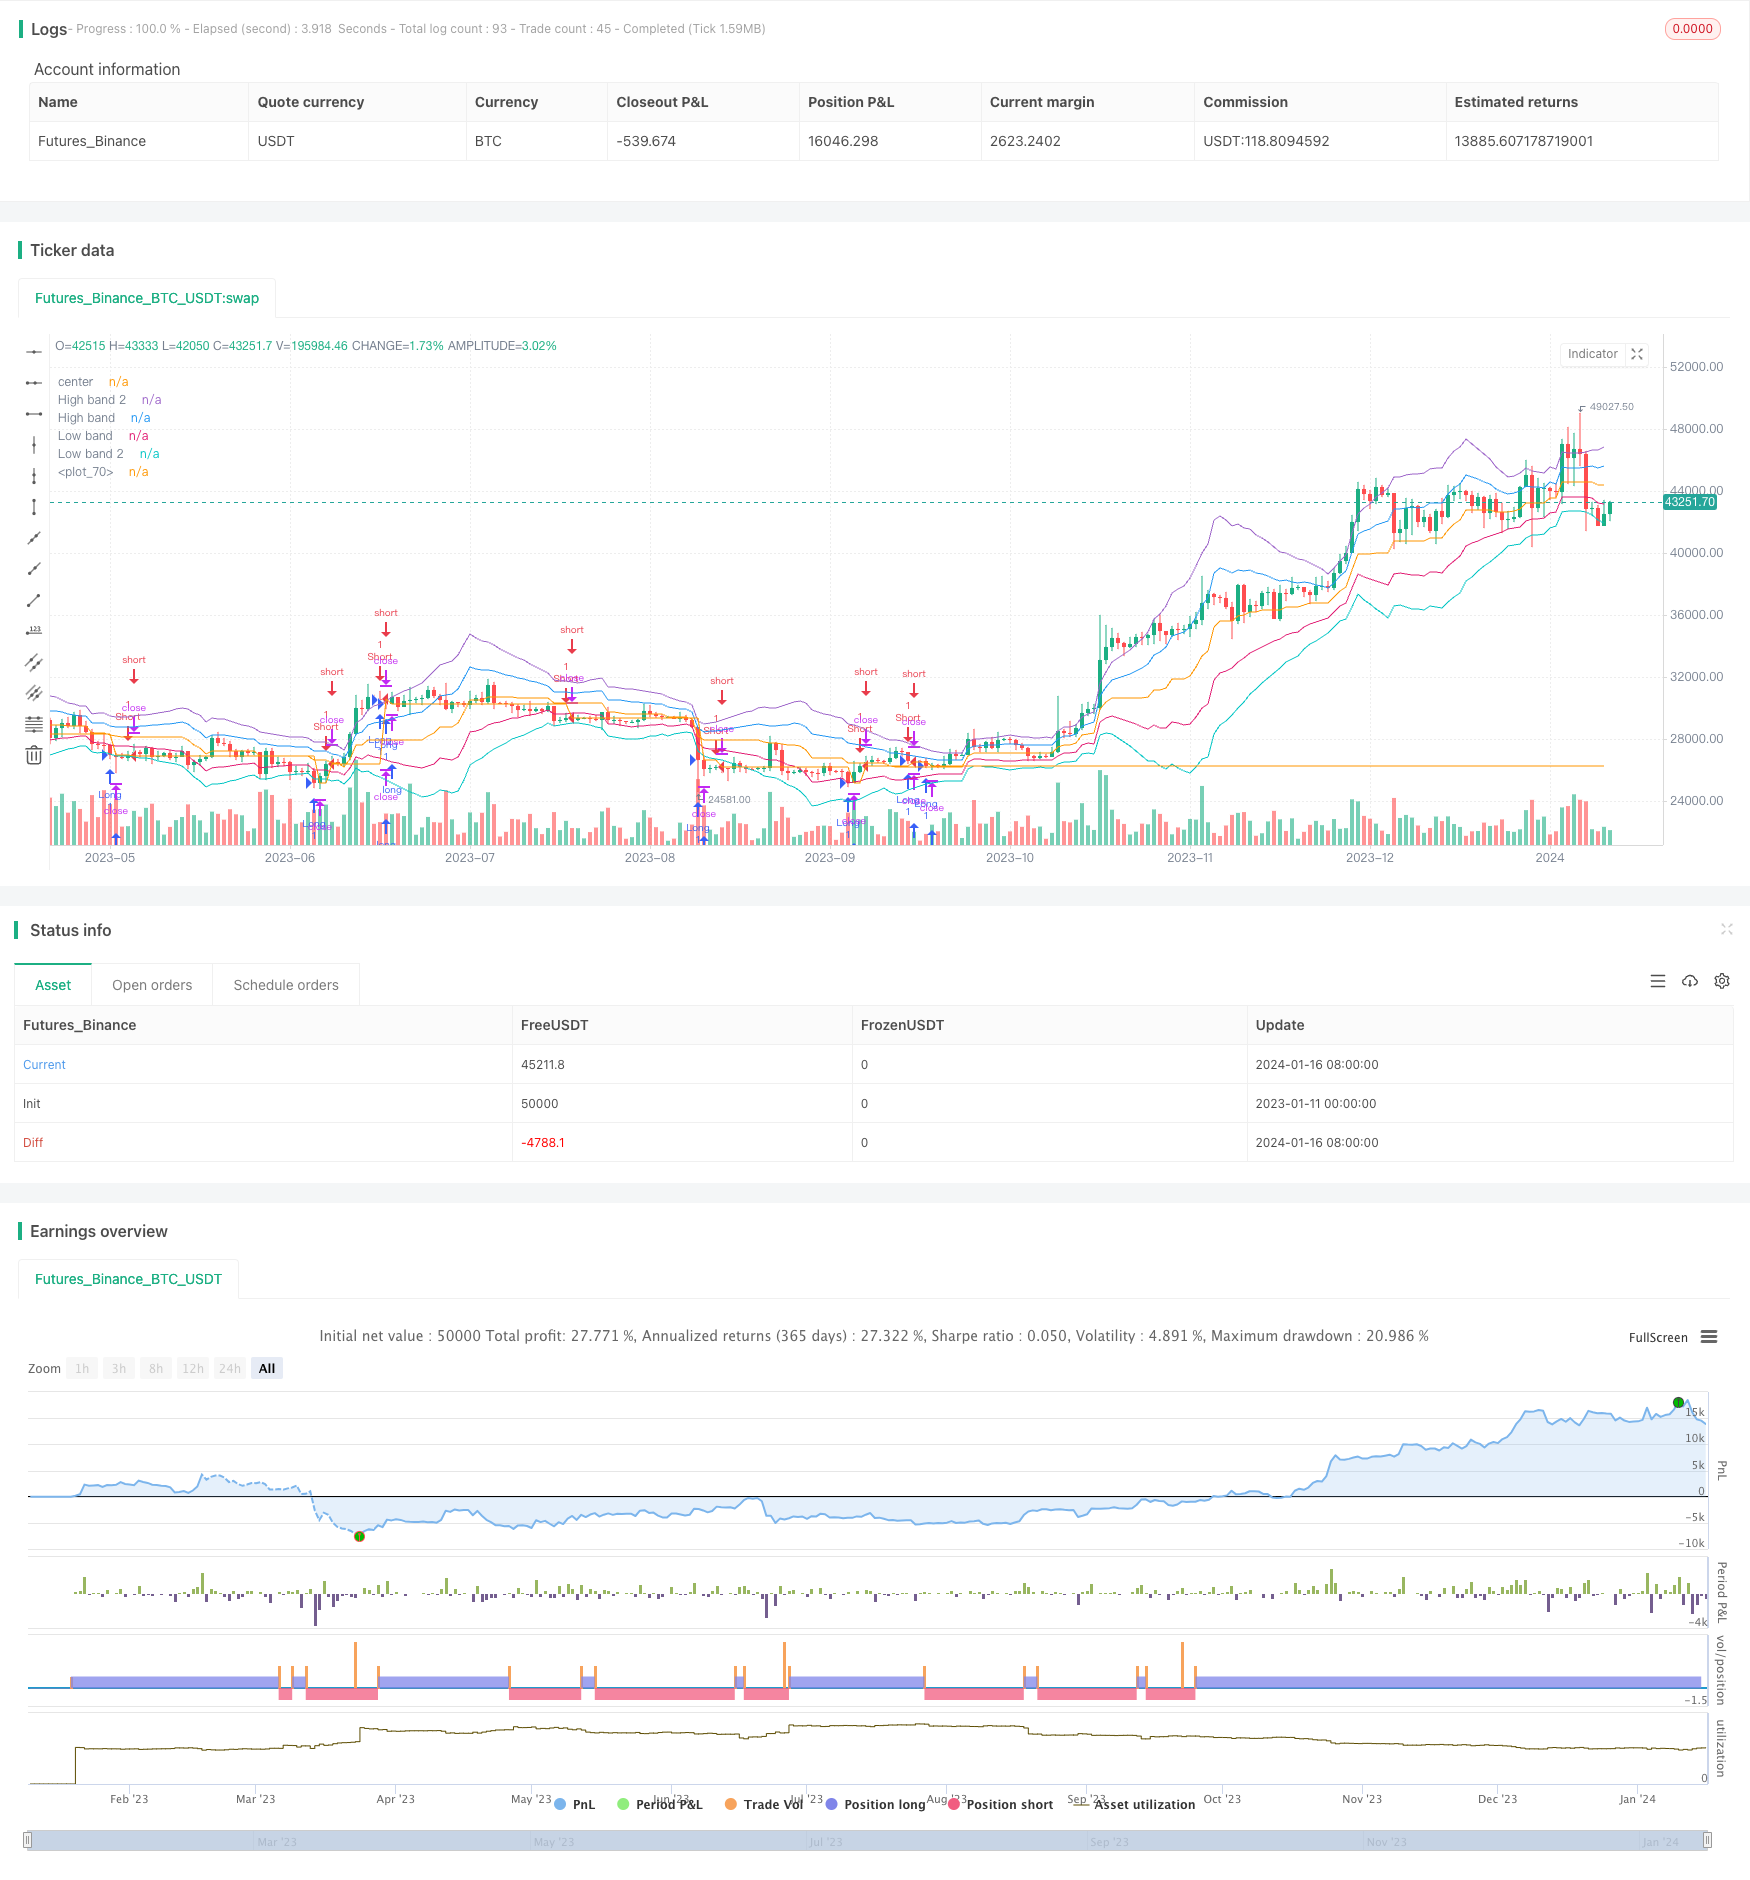
モメンタムポジショナルノロバンド戦略
作成日:
2024-01-18 10:58:48
最終変更日:
2024-01-18 10:58:48
コピー:
1
クリック数:
577
1
フォロー
1628
フォロワー

概要
この戦略は,Noroの波段理論と量化技術の組み合わせによる動力突破戦略である.これは,平均線,RSI,波段,そして牛熊色などの複数の指標を計算することによって,買入シグナルを形成し,波段突破取引を実現する.
戦略原則
- 平均真波幅から波段の上下軌を計算する. 価格が上軌を突破することは看板信号であり,下軌を突破することは下向き信号である.
- RSI指標で判断すると,RSIは30を下回り,70を下回っている.
- 価格の動向は,最高価格と最低価格の突破によって判断されます.
- 牛・熊の色によって多頭と空頭市場を判断する.緑色は多頭市場,看板;赤色は空頭市場,看板.
- 平均線判断の偏差を組み合わせて取引信号を発する.
優位分析
- 複数の指標の組み合わせにより,精度が向上します.
- 波段理論と量化技術の組み合わせにより,戦略はより効果的になる.
- 動力突破と反転取引が組み合わせられ,利益の余地が拡大した.
- 拡張性があり,市場のパラメータに応じて調整できます.
リスク分析
- パラメータの設定は,常に最適化とテストを必要とします.
- 複数の空間の切り替えに間に合わない場合,損失が発生する可能性があります.
- 取引の頻度が高く,取引手数料やスライドポイントの影響を受けやすい.
- 波段のパラメータを異なる周期に合わせて調整する必要があります.
最適化の方向
- 複数のタイムサイクルで検証し,最適なパラメータの組み合わせを探します.
- 単一損失を減らすために, Stop Loss 戦略を高めましょう.
- ポジション管理の強化と収益性の向上
- ディープ・ラーニングと組み合わせたパラメータの自動最適化.
要約する
この戦略は,動量指標と逆転指標を組み合わせて高効率の利益を達成するために,多くの典型的な定量化技術指標を総合的に使用する.また,平均真波幅理論を使用して合理的な入場ポイントを探している.技術指標と理論を組み合わせた典範である.パラメータの最適化とリスク制御の継続的な改善により,高効率の安定化戦略になる.
ストラテジーソースコード
/*backtest
start: 2023-01-11 00:00:00
end: 2024-01-17 00:00:00
period: 1d
basePeriod: 1h
exchanges: [{"eid":"Futures_Binance","currency":"BTC_USDT"}]
*/


//@version=2
strategy("Noro's Bands Strategy v1.5", shorttitle = "NoroBands str 1.5", overlay=true)

//Settings
needlong = input(true, defval = true, title = "Long")
needshort = input(true, defval = true, title = "Short")
len = input(20, defval = 20, minval = 2, maxval = 200, title = "Period")
color = input(true, defval = true, title = "Use ColorBar")
usecb = input(true, defval = true, title = "Use CryptoBottom")
usersi = input(true, defval = true, title = "Use RSI")
usemm = input(true, defval = true, title = "Use min/max")
usepyr = input(true, defval = true, title = "Use pyramiding")
needbb = input(false, defval = false, title = "Show Bands")
needbg = input(false, defval = false, title = "Show Background")
needlo = input(false, defval = false, title = "Show Locomotive")
needpy = input(false, defval = false, title = "Show Avg.price line")
src = close

//Fast RSI
fastup = rma(max(change(src), 0), 2)
fastdown = rma(-min(change(src), 0), 2)
fastrsi = fastdown == 0 ? 100 : fastup == 0 ? 0 : 100 - (100 / (1 + fastup / fastdown))

//CryptoBottom
mac = sma(close, 10)
lencb = abs(close - mac)
sma = sma(lencb, 100)
max = max(open, close)
min = min(open, close)

//PriceChannel
lasthigh = highest(src, len)
lastlow = lowest(src, len)
center = (lasthigh + lastlow) / 2

//dist
dist = abs(src - center)
distsma = sma(dist, len)
hd = center + distsma
ld = center - distsma
hd2 = center + distsma * 2
ld2 = center - distsma * 2

//Trend
trend = close < ld and high < hd ? -1 : close > hd and low > ld ? 1 : trend[1]

//Lines
colo = needbb == false ? na : black
plot(hd2, color = colo, linewidth = 1, transp = 0, title = "High band 2")
plot(hd, color = colo, linewidth = 1, transp = 0, title = "High band")
plot(center, color = colo, linewidth = 1, transp = 0, title = "center")
plot(ld, color = colo, linewidth = 1, transp = 0, title = "Low band")
plot(ld2, color = colo, linewidth = 1, transp = 0, title = "Low band 2")

//Background
col = needbg == false ? na : trend == 1 ? lime : red
bgcolor(col, transp = 80)

//Signals
up = trend == 1 and ((close < open or color == false) or close < hd) and (min < min[1] or usemm == false) and (close < strategy.position_avg_price or usepyr == false or strategy.position_size <= 0) ? 1 : 0
dn = trend == -1 and ((close > open or color == false) or close > ld) and (max > max[1] or usemm == false) and (close > strategy.position_avg_price or usepyr == false or strategy.position_size >= 0) ? 1 : 0
up2 = close < open and lencb > sma * 3 and min < min[1] and fastrsi < 10 and (close < strategy.position_avg_price or usepyr == false or strategy.position_size <= 0) ? 1 : 0 //CryptoBottom
//dn2 = close > open and len > sma * 3 and max > max[1] and fastrsi > 90 ? 1 : 0 //CryptoBottom
up3 = fastrsi < 5 and usersi == true and (close < strategy.position_avg_price or usepyr == false or strategy.position_size <= 0) ? 1 : 0
//dn3 = fastrsi > 95 and usersi = true ? 1 : 0

//Avg Price
colpy = needpy == false ? na : black
plot(strategy.position_avg_price, color = colpy)

up4 = close < strategy.position_avg_price and usepyr == true and strategy.position_size >= 0 ? 1 : 0
dn4 = close > strategy.position_avg_price and usepyr == true and strategy.position_size <= 0 ? 1 : 0

//Locomotive
uploco = trend == 1 and close < open and min < min[1] and close < center ? 1 : 0
plotarrow(needlo == true and uploco == 1 ? 1 : 0, colorup = black, colordown = black, transp = 0)

longCondition = up == 1 or (up2 == 1 and usecb == true) or (up3 == 1 and usersi == true) or up4 == 1
if (longCondition)
    strategy.entry("Long", strategy.long, needlong == false ? 0 : na)

shortCondition = dn == 1 or dn4 == 1
if (shortCondition)
    strategy.entry("Short", strategy.short, needshort == false ? 0 : na)