移動平均と相対力指数に基づく定量取引戦略
概要
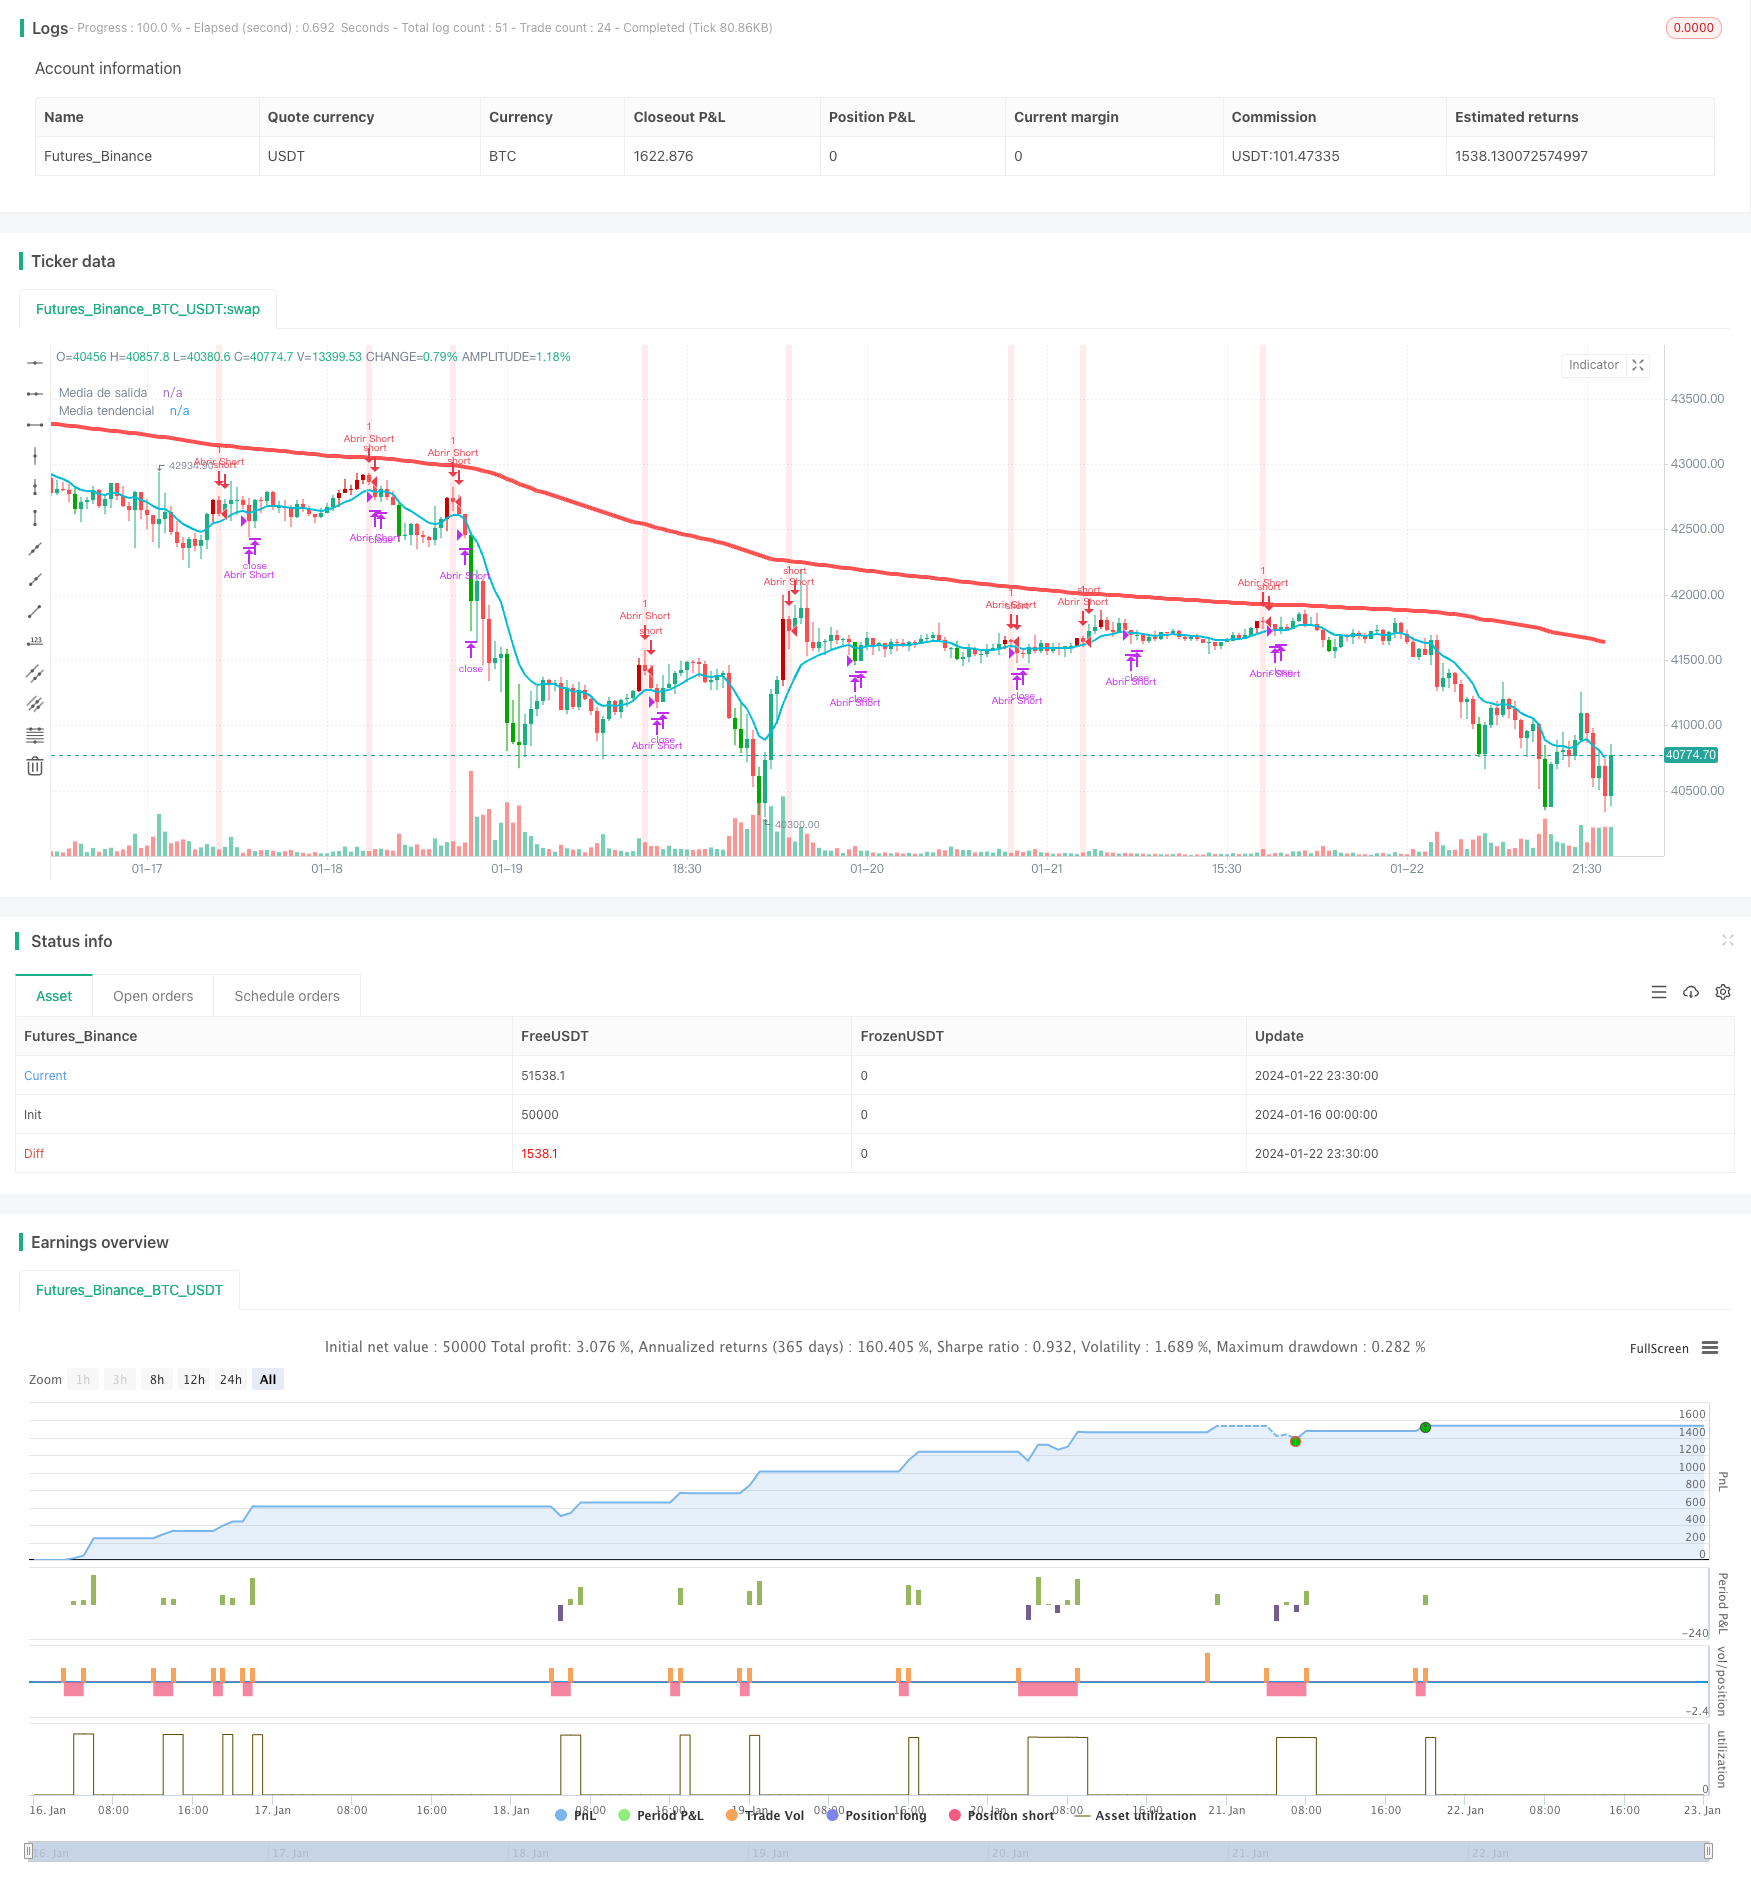
力場突破戦略は,移動平均と相対的に強い指数に基づいた定量取引戦略である.この戦略は,価格が重要な移動平均を突破したときに市場のトレンド方向を判断し,RSI指標と組み合わせて入場時刻を決定する.核心的な考えは,価格が移動平均を突破したときに,RSI指標の超超買い信号に付加して取引シグナルを発信することです.
戦略原則
フォースフィールド突破戦略は,2つの移動平均線を使用し,最初の10周期のEMAを急速移動平均線として,第二の200周期のEMAを遅い移動平均線として使用する.急速線は現在の価格傾向を表し,遅い線は長期の価格傾向を表します.価格が上昇して10日線を突破すると,看板信号であり,下落して10日線を突破すると,看板信号になります.
この戦略はまた,特定の入場時刻を決定するためにRSI指標を組み合わせます.価格が上昇傾向にある場合,RSI低点が急速移動平均線の下にあるとき (RSI指標は5より小さい) 複数の信号を発信します.価格が低下傾向にある場合,RSI高点が急速移動平均線上にあるとき (RSI指標は95より大きい) ゼロ信号を発信します.
余分な空白後,価格が再び10日線を下回ったり破ったりすると,出場を停止する.
戦略的優位分析
この戦略の最大の優点は,そのトレンド追跡能力の強さである。移動平均は,それ自体で良いトレンド判断機能を持っている。戦略は,速い,ゆっくりとした平均線の優位性を充分に利用し,速い線は短期トレンドの方向を判断し,ゆっくりとした線は長期トレンドの方向を判断する。速い線がゆっくりとした線を突破すると,株価が短期および長期の両方で上昇傾向にあることを示す,これはより強い買入シグナルである。
RSI指標の加入は,戦略の優位性をさらに高めます. RSIの高低の組み合わせは,過剰買い過剰売りが発生したときに取引信号を効果的に発信し,その結果,可能な逆転点で入場し,戦略の実戦効果を高めます.
リスク分析
この戦略は強いトレンド追跡能力を有しているが,いかなる技術指標戦略も完全に損失を回避することはできません.一定のリスクが残っています.具体的には,以下のリスクがあります.
- 価格が急激に波動すると,移動平均で生成される取引シグナルが遅れる可能性があります.
- RSIは偏差が起こりやすいため,取引シグナル判断に誤りがあります.
- 長期にわたって,パラメータを誤って設定すると,過剰な取引が起こる可能性があります.
リスクを軽減するために,移動平均のパラメータを調整し,RSIパラメータの組み合わせを最適化し,ストップラインの距離を適切に緩和し,ポジションのサイズを合理的に制御する.最適化されたパラメータの組み合わせは,反測で十分に検証されるべきである.
戦略最適化の方向性
この戦略は,次のいくつかの側面に焦点を当てて,さらなる最適化のための余地があります.
適応性のある移動平均を追加し,市場の変動率に応じて移動平均のパラメータを自動的に調整し,より柔軟にします.
ブリン帯のような波動率指標を導入することで,価格の激しい波動の市場の状況に効果的に対応できる.
機械学習のアルゴリズムを追加し,AI訓練によってより良いパラメータセットと取引ルールを獲得し,戦略をより賢くする.
複数の市場を組み合わせ,テストサンプルを拡大し,異なる市場間の戦略の有効性を証明する.
市場動向を判断し,戦略的決定の根拠を提供するために,マクロ政策,重大事件などの基本的分析モジュールを導入します.
要約する
力場突破戦略は,非常に実用的な移動平均戦略である. それは,価格が急激に平均線を突破する原理を活用してトレンドを判断し,RSI指標を補足して正確に入場する. この組み合わせは,平均線と超買い超売り指標の優位性を十分に発揮している. この戦略は,複数の市場で実証され,収益は安定し,リスクは制御可能であり,推奨される量化取引戦略である.
/*backtest
start: 2024-01-16 00:00:00
end: 2024-01-23 00:00:00
period: 30m
basePeriod: 15m
exchanges: [{"eid":"Futures_Binance","currency":"BTC_USDT"}]
*/

// This source code is subject to the terms of the Mozilla Public License 2.0 at https://mozilla.org/MPL/2.0/
// © JoseMetal
//@version=5

//== Constantes
c_blanco              = color.rgb(255, 255, 255, 0)
c_negro               = color.rgb(0, 0, 0, 0)
c_amarillo_radiactivo = color.rgb(255, 255, 0, 0)
c_cian_radiactivo     = color.rgb(0, 255, 255, 0)
c_verde_radiactivo    = color.rgb(0, 255, 0, 0)
c_verde               = color.rgb(0, 128, 0, 0)
c_verde_oscuro        = color.rgb(0, 80, 0, 0)
c_rojo_radiactivo     = color.rgb(255, 0, 0, 0)
c_rojo                = color.rgb(128, 0, 0, 0)
c_rojo_oscuro         = color.rgb(80, 0, 0, 0)
c_naranja_oscuro      = color.rgb(200, 120, 0, 0)
noneColor             = color.new(color.white, 100)
max_float             = 10000000000.0


//== Funciones

//== Declarar estrategia y período de testeo
strategy("Estrategia Larry Connors", shorttitle="Estrategia Larry Connors", overlay=true)
fecha_inicio     = input(timestamp("1 Jan 2000"), title="• Fecha de inicio", group="Período de pruebas", inline="periodo_de_pruebas")
vela_en_fecha    = true
posicion_abierta = strategy.position_size != 0
LONG_abierto     = strategy.position_size > 0
SHORT_abierto    = strategy.position_size < 0

GRUPO_P           = "Posiciones"
P_permitir_LONGS  = input.bool(title="LONGS", group=GRUPO_P, defval=true, inline="posiciones")
P_permitir_SHORTS = input.bool(title="SHORTS", group=GRUPO_P, defval=true, inline="posiciones")

GRUPO_general = "General"
mostrar_color_velas = input.bool(title="Colorear velas", defval=true, group=GRUPO_general)


//== Inputs de indicadores
// Medias móviles simples
GRUPO_SMAs = "SMAs"
SMA_1_fuente = input.source(title="• (Media de salida) Fuente / Long.", group=GRUPO_SMAs, defval=close, inline="sma_1")
SMA_1_length = input.int(title="", group=GRUPO_SMAs, defval=10, minval=1, inline="sma_1")
SMA_2_fuente = input.source(title="• (Media tendencial) Fuente / Long.", group=GRUPO_SMAs, defval=close, inline="sma_2")
SMA_2_length = input.int(title="", group=GRUPO_SMAs, defval=200, minval=1, inline="sma_2")
SMA_1        = ta.ema(SMA_1_fuente, SMA_1_length)
SMA_2        = ta.ema(SMA_2_fuente, SMA_2_length)

// RSI
GRUPO_RSI    = "RSI"
RSI_src      = input.source(title="• Fuente / Longitud", group=GRUPO_RSI, defval=close, inline="rsi_calc")
RSI_length   = input.int(title="", group=GRUPO_RSI, defval=2, minval=1, inline="rsi_calc")
RSI          = ta.rsi(RSI_src, RSI_length)
RSI_nivel_os = input.int(title="• Sobreventa / Sobrecompra", group=GRUPO_RSI, defval=5, minval=0, maxval=99, inline="rsi_niveles")
RSI_nivel_ob = input.int(title="", group=GRUPO_RSI, defval=95, minval=1, maxval=100, inline="rsi_niveles")


//== Cálculo de condiciones
cierre_sobre_SMA_1 = close > SMA_1
tendencia_alcista  = close > SMA_2
RSI_en_sobreventa  = RSI < RSI_nivel_os
RSI_en_sobrecompra = RSI > RSI_nivel_ob


//== Entrada (deben cumplirse todas para entrar)
LONG_condition_1    = tendencia_alcista
LONG_condition_2    = not cierre_sobre_SMA_1 // Vela con cierre bajo la media rápida
LONG_condition_3    = RSI_en_sobreventa[1] and not RSI_en_sobreventa // Sobreventa en la vela anterior y ya no en la actual
all_LONG_conditions = LONG_condition_1 and LONG_condition_2 and LONG_condition_3
entrar_en_LONG      = P_permitir_LONGS and all_LONG_conditions and vela_en_fecha and not LONG_abierto

SHORT_condition_1    = not tendencia_alcista
SHORT_condition_2    = cierre_sobre_SMA_1 // Vela con cierre sobre la media rápida
SHORT_condition_3    = RSI_en_sobrecompra[1] and not RSI_en_sobrecompra // Sobrecompra en la vela anterior y ya no en la actual
all_SHORT_conditions = SHORT_condition_1 and SHORT_condition_2 and SHORT_condition_3
entrar_en_SHORT      = P_permitir_SHORTS and all_SHORT_conditions and vela_en_fecha and not SHORT_abierto

if (entrar_en_LONG)
    strategy.entry("Abrir Long", strategy.long)

if (entrar_en_SHORT)
    strategy.entry("Abrir Short", strategy.short)


//== Salida
exit_LONG_conditions  = cierre_sobre_SMA_1
exit_SHORT_conditions = not cierre_sobre_SMA_1


if (LONG_abierto and exit_LONG_conditions)
    strategy.close("Abrir Long")

if (SHORT_abierto and exit_SHORT_conditions)
    strategy.close("Abrir Short")


//== Ploteo en pantalla
// SMAs
plot(SMA_1, "Media de salida", color=color.aqua, linewidth=2)
plot(SMA_2, "Media tendencial", color=tendencia_alcista ? color.green : color.red, linewidth=4)

// Color de fondo
bgcolor = entrar_en_LONG ? color.new(color.green, 85) : entrar_en_SHORT ? color.new(color.red, 85) : color.new(color.black, 100)
bgcolor(bgcolor)

// Color de las velas según sobrecompra/sobreventa del RSI
color_velas = mostrar_color_velas ? (RSI_en_sobreventa ? #00a800 : RSI_en_sobrecompra ? #ca0000 : na) : na
barcolor(color_velas)