プログレッシブBB KCトレンド戦略
作成日:
2024-01-26 15:10:41
最終変更日:
2024-01-26 15:10:41
コピー:
3
クリック数:
905
1
フォロー
1750
フォロワー
概要
この戦略は,ブリン帯とケイトラインの信号の組み合わせを使用して,市場トレンドを識別します.ブリン帯は,価格変動の範囲に基づいてチャネルを定義する技術分析ツールです.ケイトラインは,価格の変動性とトレンド性とを組み合わせて,サポートまたは圧力を判断する技術指標です.この戦略は,ブリン帯とケイトラインの黄金の交差が起こらないかどうかを判断することによって,多空の機会を探し出すために,2つの指標の優位性を総合的に利用します.
戦略原則
- 計算20周期のブリン中軌,上軌,下軌,帯域は標準差の2倍を通過して規定する.
- 20周期のケイト中軌,上軌,下軌を計算し,帯域は実際の波動範囲の2.2倍で規定する.
- ケイトが線路でブリン帯を横切って線路に上がると,交差量が10サイクル平均より大きいときは,多めにする.
- ケイトが線下軌道下を通過し,ブリン帯の下軌道に,交差量が10周期平均より大きいとき,空置する.
- ポジション開設後20K線が退出しない場合は,強制停止止損退出する.
- オーバーの後に1.5%のストップ設定,空白の後に-1.5%のストップ設定;オーバーの後に2%のフォローストップ設定,空白の後に-2%のフォローストップ設定.
この戦略は主にブリン帯による波動の範囲と強度判断に依存し,ケイト線補助検証を利用し,異なるパラメータを持つが性質が類似する2つの指標を組み合わせて使用することで,信号の正確性を向上させ,成交量の導入も無効信号を効果的に減らすことができる.
優位分析
- ブリン帯とケイト線の両方の指標の優位性を総合的に利用することで,取引信号の正確性が向上した.
- 交替量指標を組み合わせると,市場が頻繁に衝突する無効信号を効果的に減らすことができます.
- ストップ・ロスを設定し,ストップ・ロスを追跡し,リスクを効果的に制御する.
- 無効信号後の強制停止停止損失設定は,迅速に停止停止損失を与える.
リスク分析
- ブリン帯とケイト線は,移動平均線に基づく指数であり,波動的計算を組み合わせており,震動状況で誤信号を生じやすい.
- 利回りのない仕組みで,何度も押さえられた場合,過度の損失を招く可能性があります.
- 逆転信号はより一般的で,パラメータを調整するとトレンドの機会を容易に失います. ストップローズ幅を適当に緩め,またはMACDなどの補助指標のフィルター信号を追加して,誤信号によるリスクを減らすことができます.
最適化の方向
- 戦略の収益率に対する様々なパラメータの影響をテストすることができる.例えば,調整平均線長,標準差倍数などのパラメータ.
- KDJ指数やMACD指数などの他の指標判断に信号の決定を添えることができる.
- 機械学習によりパラメータを自動的に最適化できます.
要約する
この戦略は,市場トレンドを識別するためにブリン帯とケイト線指標を総合的に使用し,取引量指標を補足してシグナルを検証する.パラメータ最適化,他の技術指標を追加するなどによって,この戦略をさらに強化し,より広範な市場状況に適応できるようにすることができる.この戦略は,全体的に有力であり,容易に把握し,調整できる量化取引戦略の1つです.
ストラテジーソースコード
/*backtest
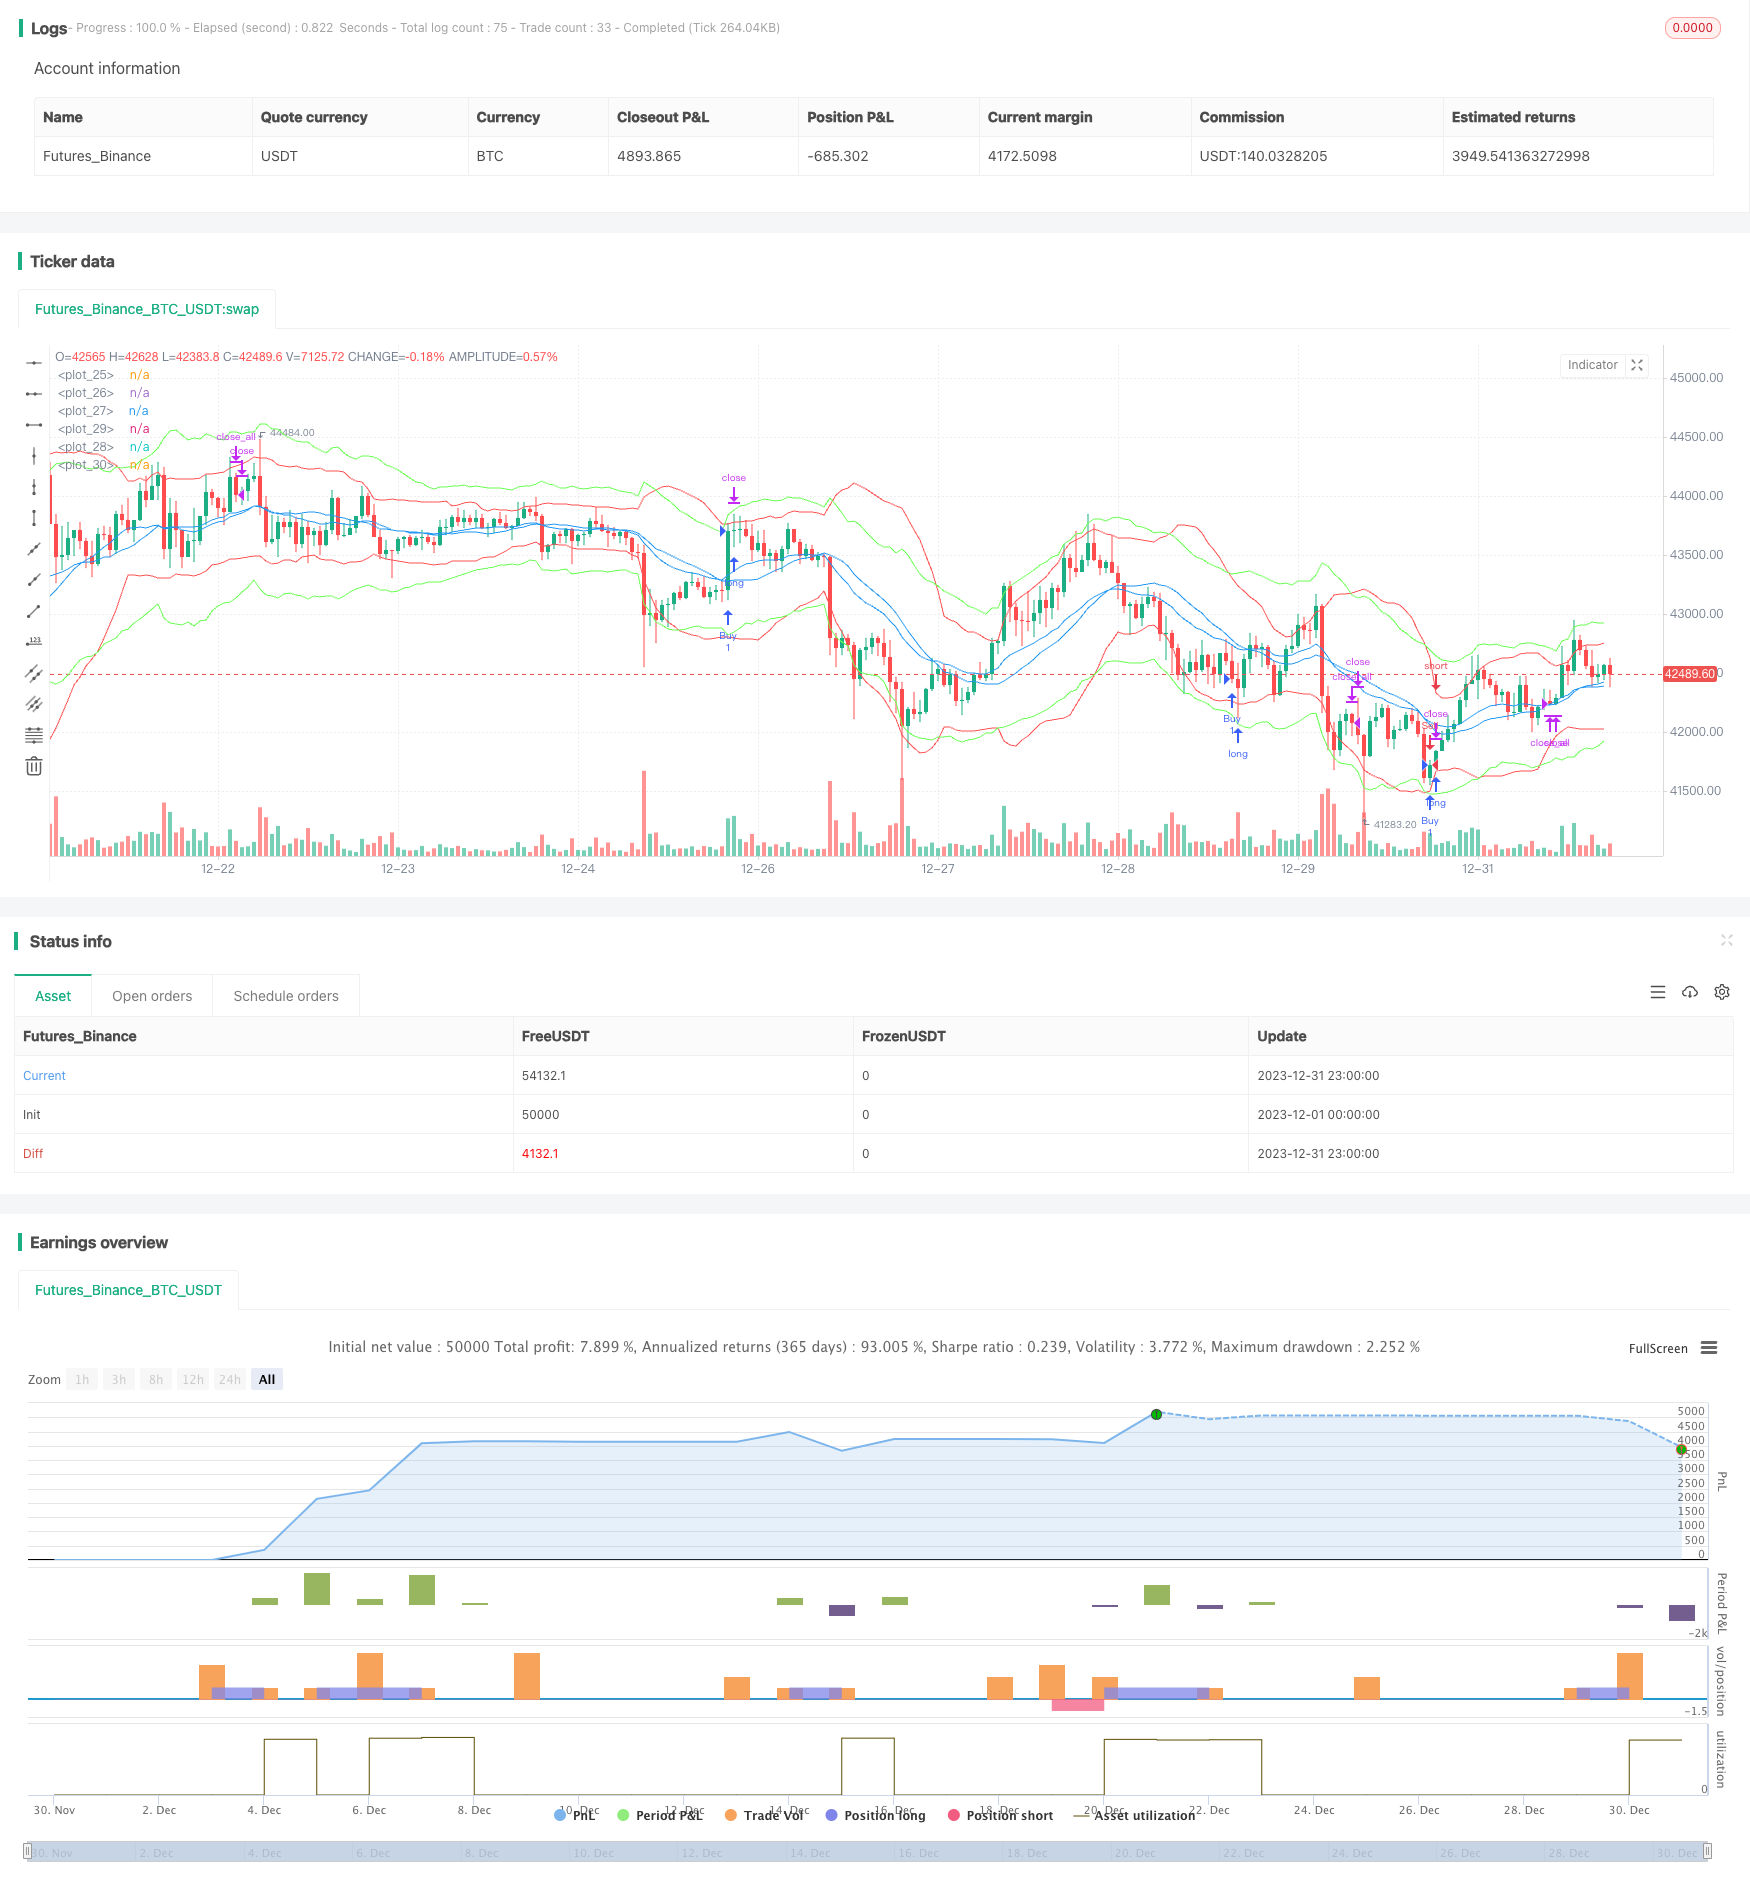
start: 2023-12-01 00:00:00
end: 2023-12-31 23:59:59
period: 1h
basePeriod: 15m
exchanges: [{"eid":"Futures_Binance","currency":"BTC_USDT"}]
*/
// This source code is subject to the terms of the Mozilla Public License 2.0 at https://mozilla.org/MPL/2.0/
// © jensenvilhelm
//@version=5
strategy("BB and KC Strategy", overlay=true)
// Define the input parameters for the strategy, these can be changed by the user to adjust the strategy
kcLength = input.int(20, "KC Length", minval=1) // Length for Keltner Channel calculation
kcStdDev = input.float(2.2, "KC StdDev") // Standard Deviation for Keltner Channel calculation
bbLength = input.int(20, "BB Length", minval=1) // Length for Bollinger Bands calculation
bbStdDev = input.float(2, "BB StdDev") // Standard Deviation for Bollinger Bands calculation
volumeLength = input.int(10, "Volume MA Length", minval=1) // Length for moving average of volume calculation
stopLossPercent = input.float(1.5, "Stop Loss (%)") // Percent of price for Stop loss
trailStopPercent = input.float(2, "Trail Stop (%)") // Percent of price for Trailing Stop
barsInTrade = input.int(20, "Bars in trade before exit", minval = 1) // Minimum number of bars in trade before considering exit
// Calculate Bollinger Bands and Keltner Channel
[bb_middle, bb_upper, bb_lower] = ta.bb(close, bbLength, bbStdDev) // Bollinger Bands calculation
[kc_middle, kc_upper, kc_lower] = ta.kc(close, kcLength, kcStdDev) // Keltner Channel calculation
// Calculate moving average of volume
vol_ma = ta.sma(volume, volumeLength) // Moving average of volume calculation
// Plotting Bollinger Bands and Keltner Channels on the chart
plot(bb_upper, color=color.red) // Bollinger Bands upper line
plot(bb_middle, color=color.blue) // Bollinger Bands middle line
plot(bb_lower, color=color.red) // Bollinger Bands lower line
plot(kc_upper, color=color.rgb(105, 255, 82)) // Keltner Channel upper line
plot(kc_middle, color=color.blue) // Keltner Channel middle line
plot(kc_lower, color=color.rgb(105, 255, 82)) // Keltner Channel lower line
// Define entry conditions: long position if upper KC line crosses above upper BB line and volume is above MA of volume
// and short position if lower KC line crosses below lower BB line and volume is above MA of volume
longCond = ta.crossover(kc_upper, bb_upper) and volume > vol_ma // Entry condition for long position
shortCond = ta.crossunder(kc_lower, bb_lower) and volume > vol_ma // Entry condition for short position
// Define variables to store entry price and bar counter at entry point
var float entry_price = na // variable to store entry price
var int bar_counter = na // variable to store bar counter at entry point
// Check entry conditions and if met, open long or short position
if (longCond)
strategy.entry("Buy", strategy.long) // Open long position
entry_price := close // Store entry price
bar_counter := 1 // Start bar counter
if (shortCond)
strategy.entry("Sell", strategy.short) // Open short position
entry_price := close // Store entry price
bar_counter := 1 // Start bar counter
// If in a position and bar counter is not na, increment bar counter
if (strategy.position_size != 0 and na(bar_counter) == false)
bar_counter := bar_counter + 1 // Increment bar counter
// Define exit conditions: close position if been in trade for more than specified bars
// or if price drops by more than specified percent for long or rises by more than specified percent for short
if (bar_counter > barsInTrade) // Only consider exit after minimum bars in trade
if (bar_counter >= barsInTrade)
strategy.close_all() // Close all positions
// Stop loss and trailing stop
if (strategy.position_size > 0)
strategy.exit("Sell", "Buy", stop=entry_price * (1 - stopLossPercent/100), trail_points=entry_price * trailStopPercent/100) // Set stop loss and trailing stop for long position
else if (strategy.position_size < 0)
strategy.exit("Buy", "Sell", stop=entry_price * (1 + stopLossPercent/100), trail_points=entry_price * trailStopPercent/100) // Set stop loss and trailing stop for short position