トレンドフォロー移動平均クロスオーバー戦略
作成日:
2024-01-29 16:52:46
最終変更日:
2024-01-29 16:52:46
コピー:
3
クリック数:
705
1
フォロー
1750
フォロワー
概要
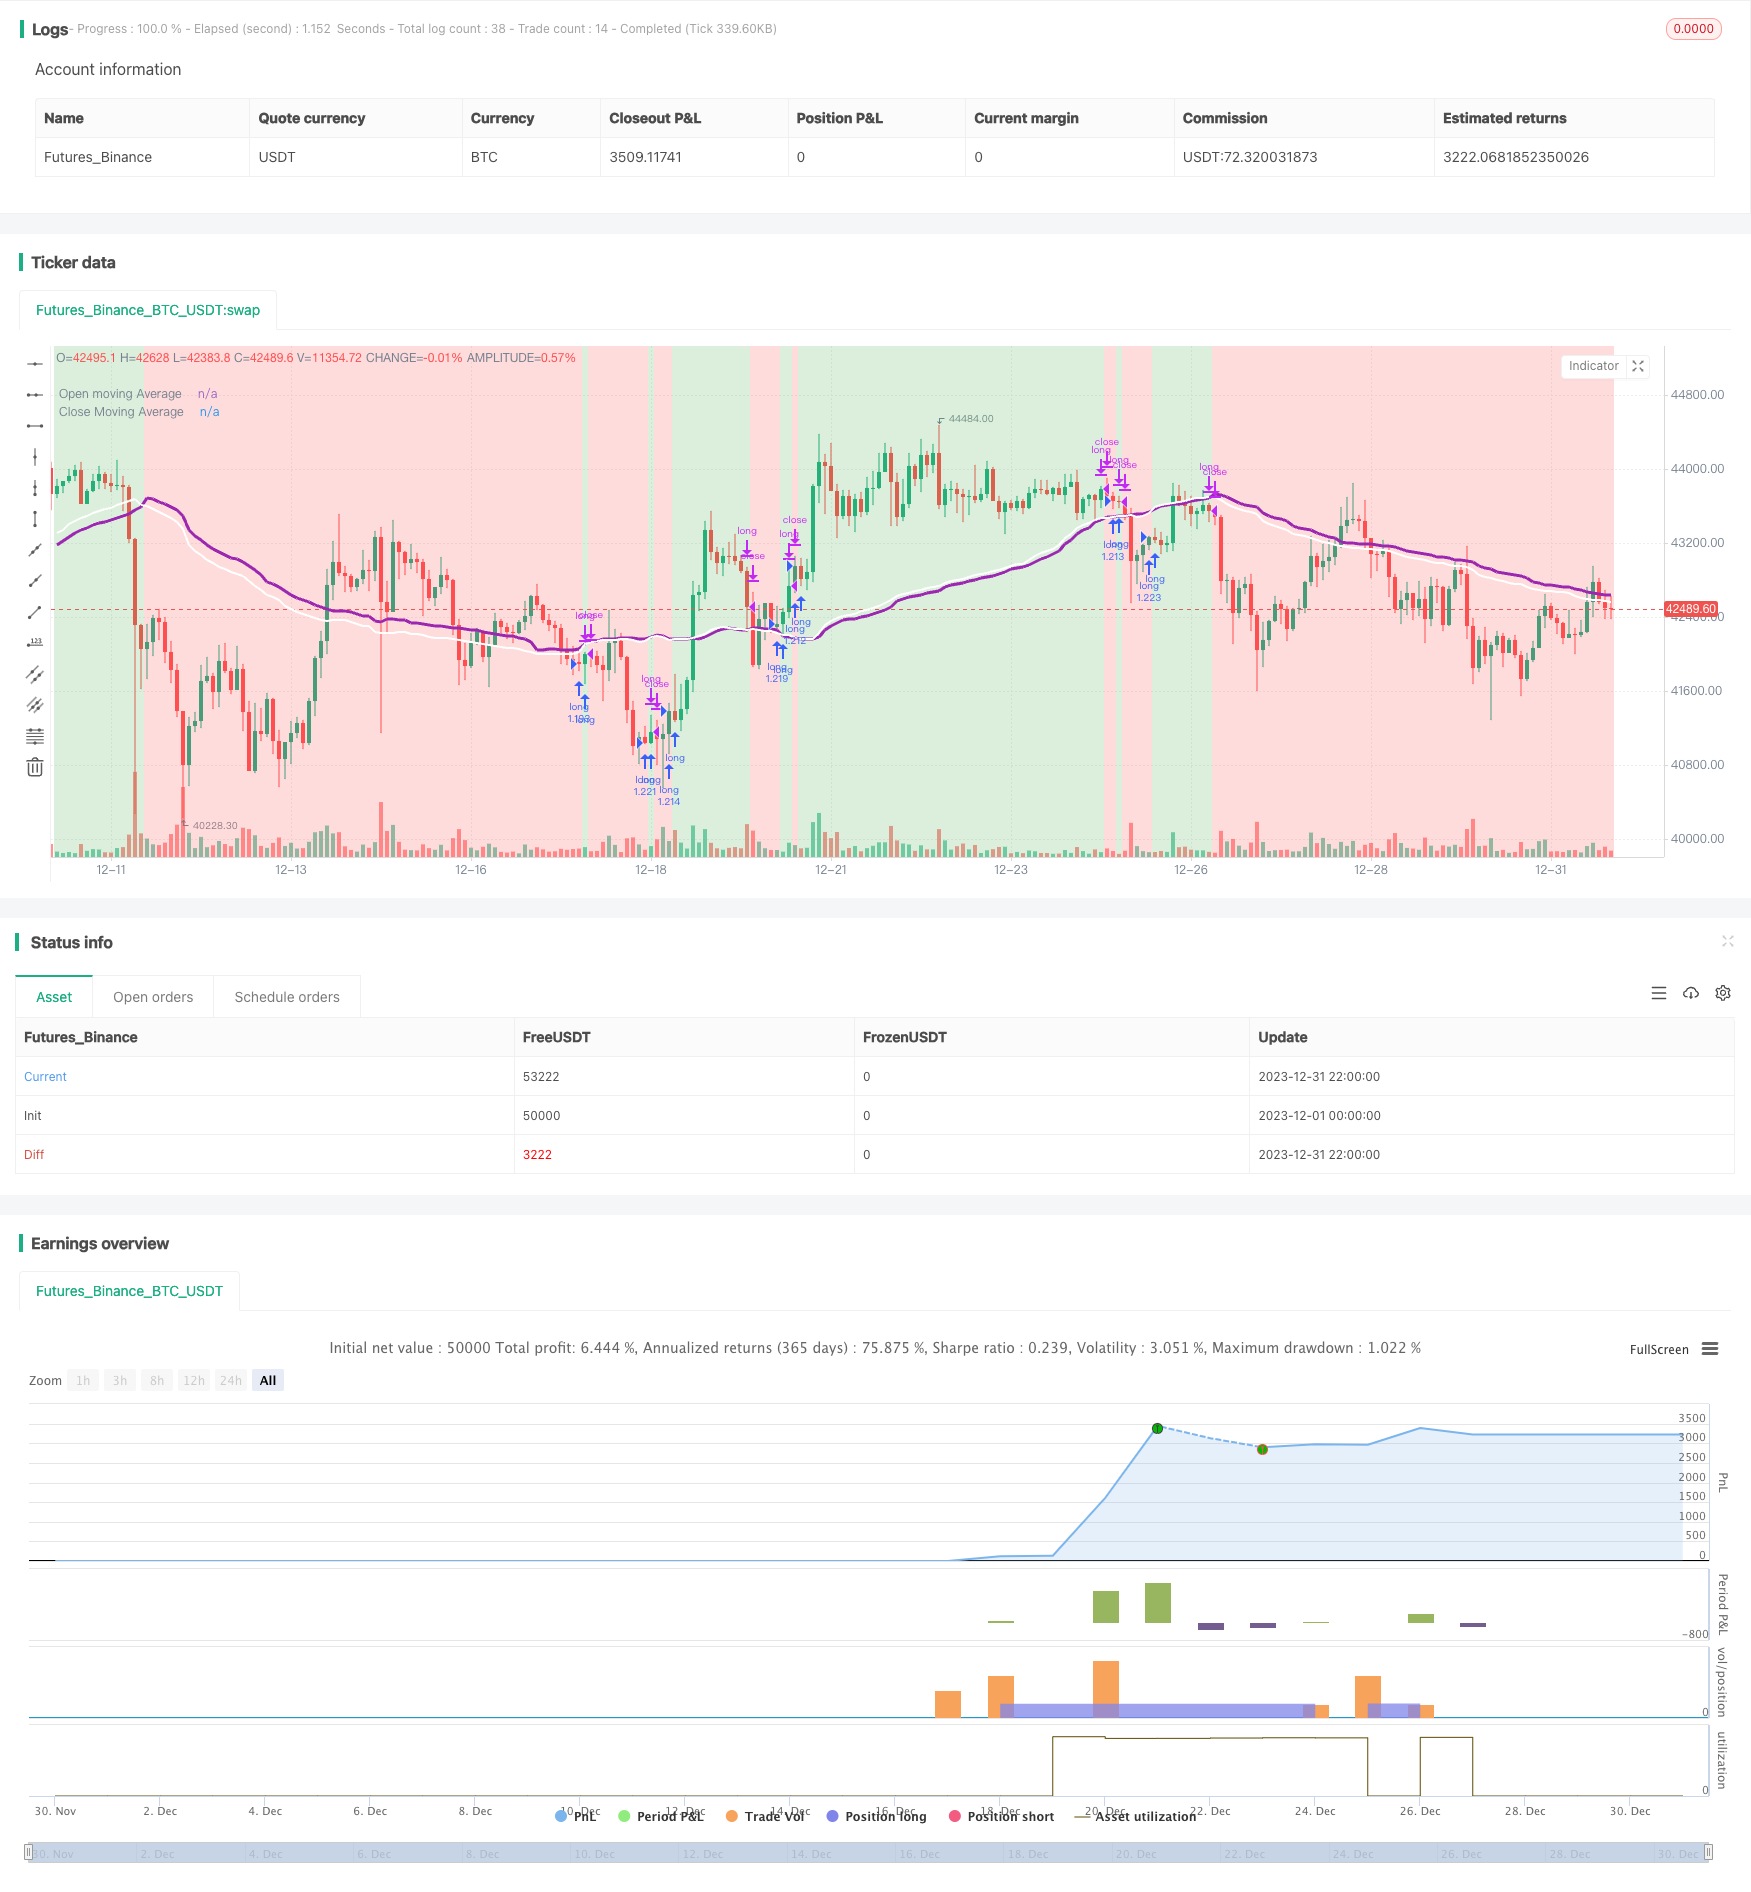
この戦略は,移動平均の簡単な戦略に基づいています.それは,異なる通貨ペアで良い結果を得ることができます.それは,開設平均と閉じる平均を描画し,両線が交差するときに,多頭寸を確立または退出することを決定します.その原理は,平均閉じる価格が上昇するときに,ポジションを確立することであり,これは将来の価格が上昇することを予告します.平均閉じる価格が低下するときに,ポジションを平ら化することは,これは将来の価格が低下することを予告することができます.これは単なる推測ですが,時には非常に正確に将来の価格を予測することができます.
戦略原則
この戦略は,まず,EMA,SMA,RMA,WMA,VWMAを含む移動平均のタイプを選択します. そして,移動平均の計算周期を設定します. 通常は10から250のK線です. 異なる通貨ペアに応じて,異なる移動平均のタイプと周期数を選択すると,全く異なる効果が得られます.
この戦略の具体的取引論理は以下の通りです.
- オープン価格とクロージング価格の移動平均を計算します.
- 閉店価格の平均と開店価格の平均を比較する数値
- 閉盘平均値が開盘平均値に突破した場合,多頭ポジションを確立する.
- 閉盘平均値より開盘平均値を下回った場合,多頭ポジションを平らにする.
ポジションを確立すると,価格上昇の予兆と考え,ポジションを平らげると,価格下落の予兆と考えます.
戦略的優位分析
この戦略の利点は以下の通りです.
- パラメータの設定は柔軟で,異なる通貨ペアによる最適のパラメータの選択が可能で,ターゲット性が高い.
- 論理がシンプルで,理解し,実行しやすい.
- 特定の通貨ペアでは,非常に高い利回りを得ることができ,全体的に安定性があります.
- 需要に応じて異なる指標を表示できます.カスタマイズ度が高い.
リスク分析
この戦略にはいくつかのリスクがあります.
- 特定の通貨ペアやパラメータでは,利回りも安定性も低い.
- 短期的な価格変動に効率的に反応できず,高度に変動する通貨に対して効果的ではない.
- 移動平均周期の選択の根拠は科学的に合理的ではなく,ある程度主観的である.
対応と改善の方向:
- 12時間,1日といった長い周期を選ばれば,不必要な取引を減らし,安定性を高める.
- パラメータ最適化機能を追加し,異なるパラメータの組み合わせを自動テストして最適なパラメータを特定します.
- 移動平均周期の選択に適応する機能を追加し,最適の周期を自動的に決定させる.
要約する
この戦略は,全体的に論理的にシンプルで,移動平均指標を使用して価格の傾向と転換点を判断する.パラメータを調整することで非常に良い効果を得ることができ,さらに完善して適用する価値のある効果的なトレンド追跡戦略である.しかし,リスクを制御し,適切な通貨ペアとパラメータを選択して,最大限の効果を発揮させることに注意する必要があります.
ストラテジーソースコード
/*backtest
start: 2023-12-01 00:00:00
end: 2023-12-31 23:59:59
period: 2h
basePeriod: 15m
exchanges: [{"eid":"Futures_Binance","currency":"BTC_USDT"}]
*/

//@version=5
//Author @divonn1994

initial_balance = 100
strategy(title='Close v Open Moving Averages Strategy', shorttitle = 'Close v Open', overlay=true, pyramiding=0, default_qty_value=100, default_qty_type=strategy.percent_of_equity, precision=7, currency=currency.USD, commission_value=0.1, commission_type=strategy.commission.percent, initial_capital=initial_balance)

//Input for number of bars for moving average, Switch to choose moving average type, Display Options and Time Frame of trading----------------------------------------------------------------

bars = input.int(66, "Moving average length (number of bars)", minval=1, group='Strategy') //66 bars and VWMA for BTCUSD on 12 Hours.. 35 bars and VWMA for BTCUSD on 1 Day
strategy = input.string("VWMA", "Moving Average type", options = ["EMA", "SMA", "RMA", "WMA", "VWMA"], group='Strategy')

redOn = input.string("On", "Red Background Color On/Off", options = ["On", "Off"], group='Display')
greenOn = input.string("On", "Green Background Color On/Off", options = ["On", "Off"], group='Display')
maOn = input.string("On", "Moving Average Plot On/Off", options = ["On", "Off"], group='Display')

startMonth = input.int(title='Start Month 1-12 (set any start time to 0 for furthest date)', defval=1, minval=0, maxval=12, group='Beginning of Strategy')
startDate = input.int(title='Start Date 1-31 (set any start time to 0 for furthest date)', defval=1, minval=0, maxval=31, group='Beginning of Strategy')
startYear = input.int(title='Start Year 2000-2100 (set any start time to 0 for furthest date)', defval=2011, minval=2000, maxval=2100, group='Beginning of Strategy')

endMonth = input.int(title='End Month 1-12 (set any end time to 0 for today\'s date)', defval=0, minval=0, maxval=12, group='End of Strategy')
endDate = input.int(title='End Date 1-31 (set any end time to 0 for today\'s date)', defval=0, minval=0, maxval=31, group='End of Strategy')
endYear = input.int(title='End Year 2000-2100 (set any end time to 0 for today\'s date)', defval=0, minval=0, maxval=2100, group='End of Strategy')

//Strategy Calculations-----------------------------------------------------------------------------------------------------------------------------------------------------------------------

inDateRange = true

maMomentum = switch strategy
    "EMA" => (ta.ema(close, bars) > ta.ema(open, bars)) ? 1 : -1
    "SMA" => (ta.sma(close, bars) > ta.sma(open, bars)) ? 1 : -1
    "RMA" => (ta.rma(close, bars) > ta.rma(open, bars)) ? 1 : -1
    "WMA" => (ta.wma(close, bars) > ta.wma(open, bars)) ? 1 : -1
    "VWMA" => (ta.vwma(close, bars) > ta.vwma(open, bars)) ? 1 : -1
    =>
        runtime.error("No matching MA type found.")
        float(na)

openMA = switch strategy
    "EMA" => ta.ema(open, bars)
    "SMA" => ta.sma(open, bars)
    "RMA" => ta.rma(open, bars)
    "WMA" => ta.wma(open, bars)
    "VWMA" => ta.vwma(open, bars)
    =>
        runtime.error("No matching MA type found.")
        float(na)

closeMA = switch strategy
    "EMA" => ta.ema(close, bars)
    "SMA" => ta.sma(close, bars)
    "RMA" => ta.rma(close, bars)
    "WMA" => ta.wma(close, bars)
    "VWMA" => ta.vwma(close, bars)
    =>
        runtime.error("No matching MA type found.")
        float(na)

//Enter or Exit Positions--------------------------------------------------------------------------------------------------------------------------------------------------------------------

if ta.crossover(maMomentum, 0)
    if inDateRange
        strategy.entry('long', strategy.long, comment='long')
if ta.crossunder(maMomentum, 0)
    if inDateRange
        strategy.close('long')

//Plot Strategy Behavior---------------------------------------------------------------------------------------------------------------------------------------------------------------------

plot(series = maOn == "On" ? openMA : na, title = "Open moving Average", color = color.new(color.purple,0), linewidth=3, offset=1)
plot(series = maOn == "On" ? closeMA : na, title = "Close Moving Average", color = color.new(color.white,0), linewidth=2, offset=1)
bgcolor(color = inDateRange and (greenOn == "On") and maMomentum > 0 ? color.new(color.green,75) : inDateRange and (redOn == "On") and maMomentum <= 0 ? color.new(color.red,75) : na, offset=1)