CCIとEMAに基づく短期オシレーション戦略
概要
この戦略は,ショートラインの振動取引戦略であり,ショートラインの価格変動の機会をキャプチャするために,市場のショートラインの傾向と超買い超売り状態を識別するために,EMA平均線指数とCCI指数を組み合わせます.
戦略原則
この戦略は,主に10日EMA,21日EMA,50日EMAの3つの平均線とCCI指標を使用して,出場と出場のタイミングを判断する.
具体的にはこうです 短期平均線上 ((10日EMA) が中期平均線 ((21日EMA) を越え,短期平均線が長期平均線上 ((50日EMA) を越え,CCI指標が0より大きいときは多頭信号とみなして,多頭する.短期平均線下 (中期平均線) が中期平均線を越え,短期平均線は長期平均線より低いとき,CCI指標が0より小さいときは空頭信号とみなして,空空する.
平仓論理は,短期平均線が中期平均線を再び横切るときの平仓である.
戦略的優位性
均線システムとCCI指標を組み合わせると,ショートライン価格変動のトレンド方向とオーバーバイオーバーセール状態を効果的に識別できます.
均線金叉と死叉を使ってentriesとexistsを判断し,シンプルで実用的な。
CCI指標のパラメータと周期の設定は合理的で,部分的な偽信号を除することができる.
多周期平均線を用いて,波動的な市でよりよい操作機会を得ることができる.
戦略リスク
ショートライン操作の波動が大きく,連続ストープ損失がより多くなる可能性があります.
CCI指数パラメータの設定を間違えた場合,偽信号が増える可能性があります.
この戦略は,小規模な損失を繰り返し発生させることもあります.
ショートラインを頻繁に操作するトレーダーにしか適しません.
対応するリスク対応策には,CCIパラメータの最適化,ストップロスの位置の調整,フィルター条件の追加などが含まれます.
戦略最適化の方向性
異なる長さのEMA平均線組合せをテストし,パラメータを最適化する.
偽信号の一部をフィルターするために,他の指標またはフィルター条件を追加することができます.例えばMACD,KDJなど.
ダイナミック・トラッキング・ストップで単一損失を制御できます.
逆行操作を避けるため,より高い時間周期のトレンド指標を組み合わせることができます.
要約する
この戦略は,全体として,典型的なショートライン振動戦略であり,均線指標の金叉死叉とCCI指標の超買い超売り状態を組み合わせて,価格の短期的な逆転の機会を捕捉する.この戦略はショートラインの頻繁な取引に適しているが,一定の止損圧力を負う必要がある.パラメータの最適化とフィルター条件の追加により,戦略の安定性と収益性をさらに向上させることができる.
/*backtest
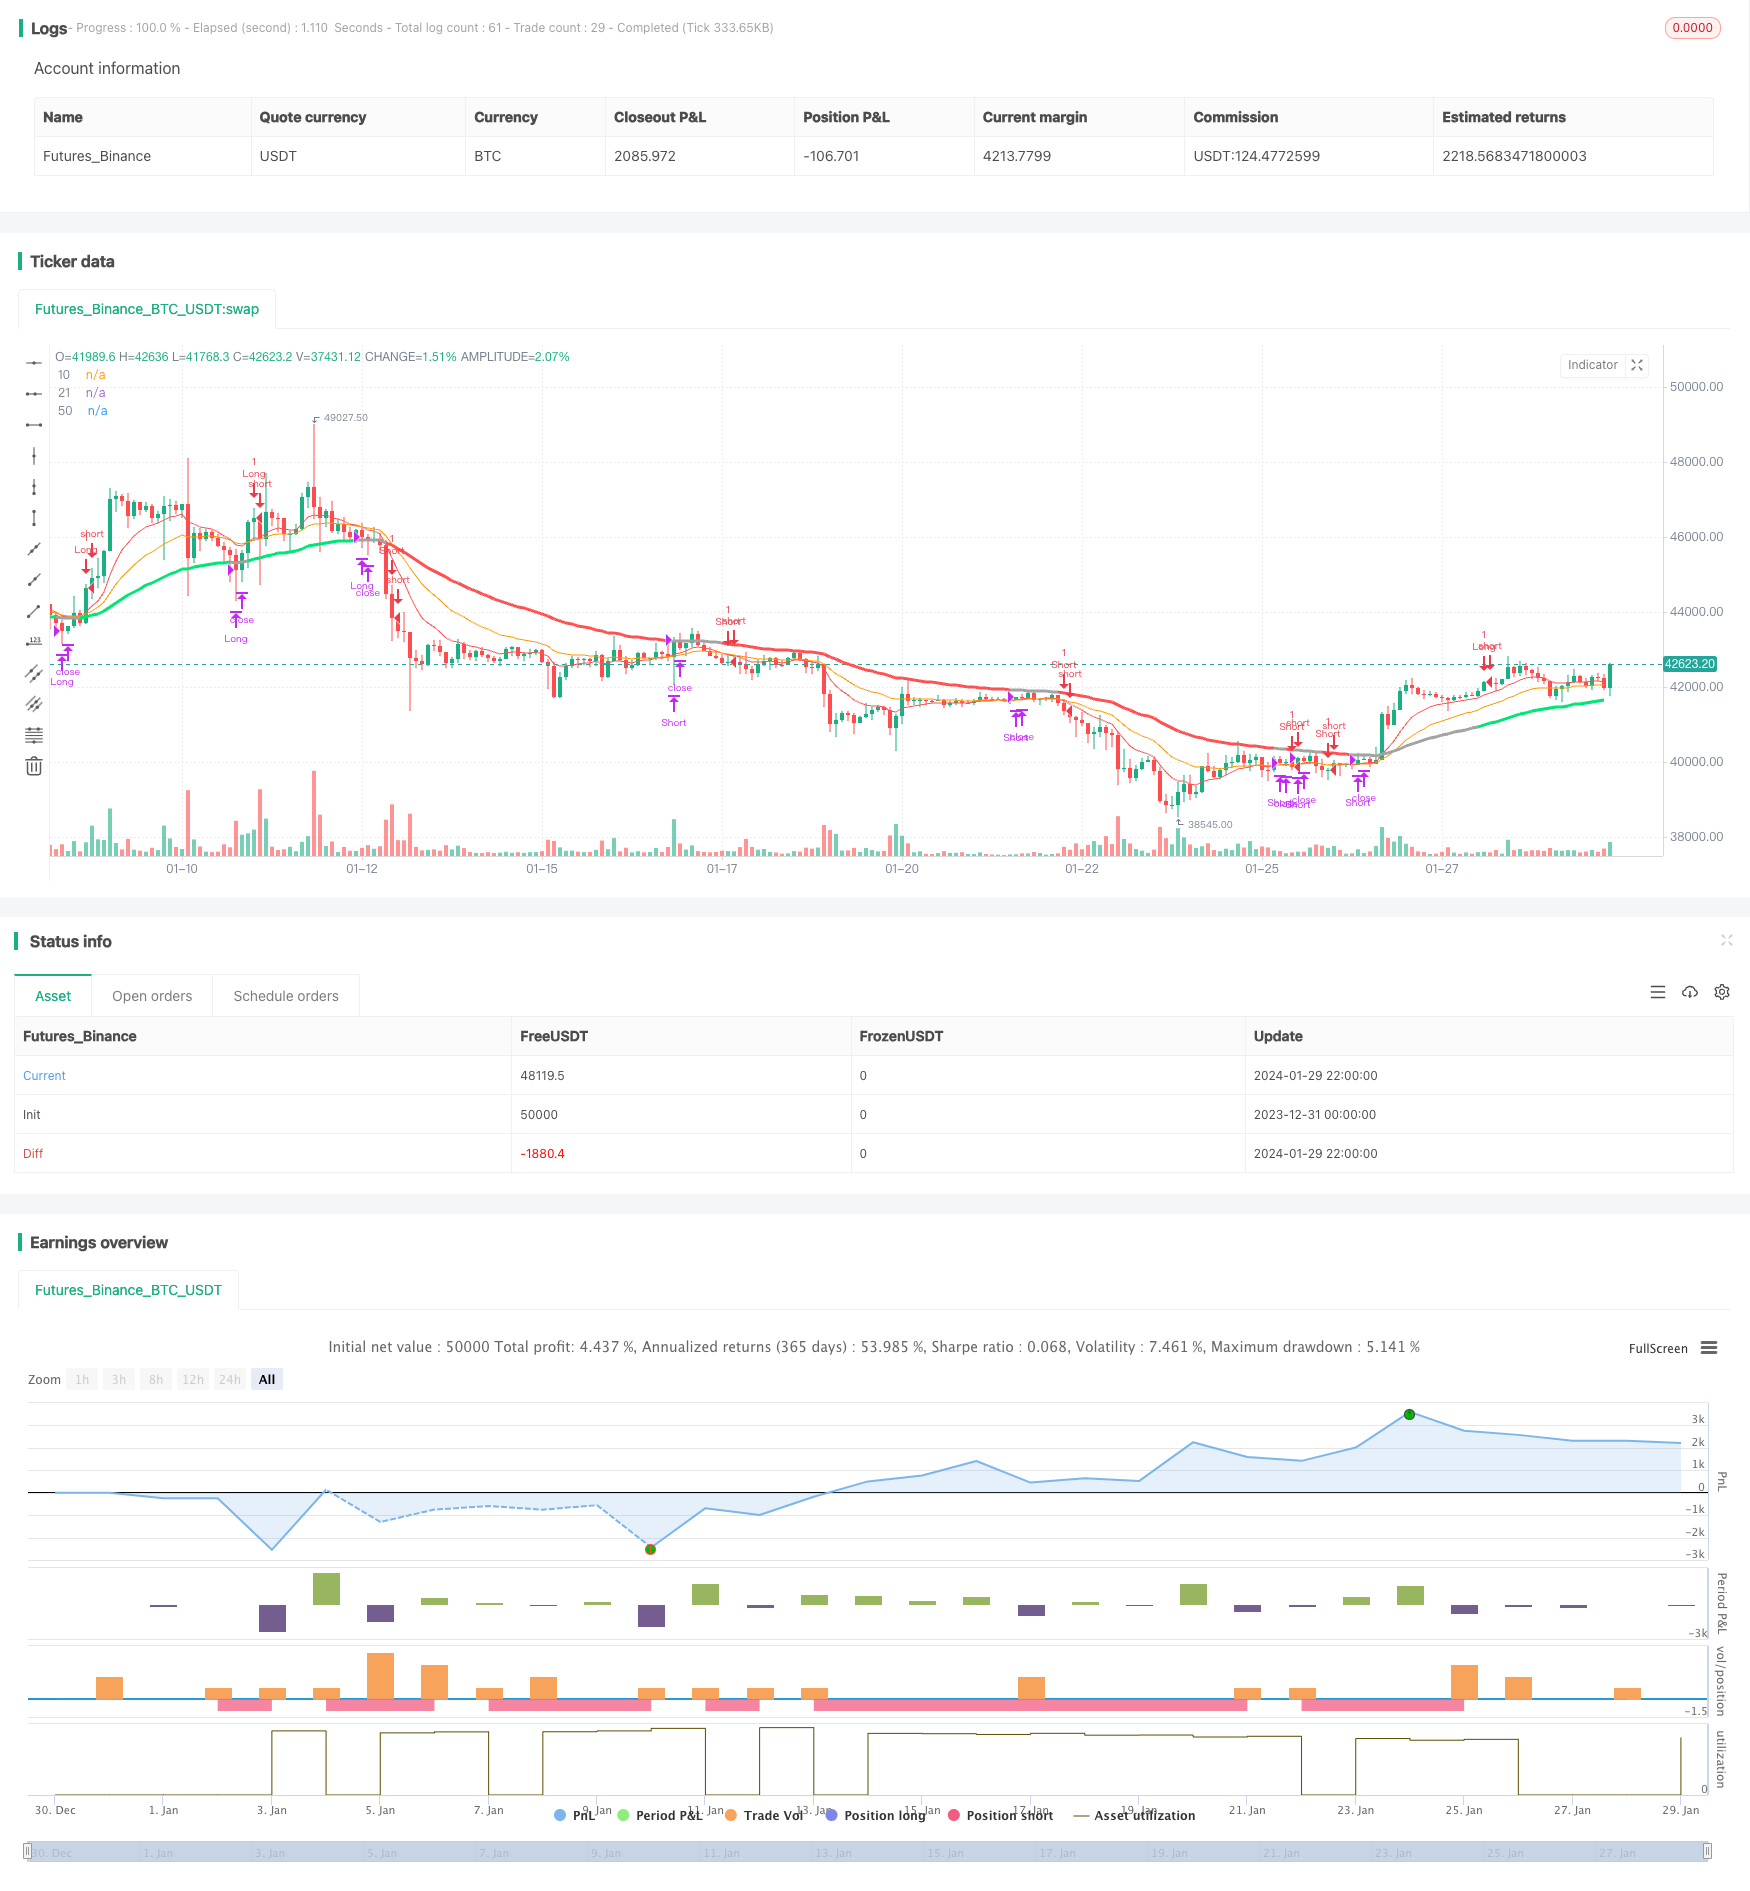
start: 2023-12-31 00:00:00
end: 2024-01-30 00:00:00
period: 2h
basePeriod: 15m
exchanges: [{"eid":"Futures_Binance","currency":"BTC_USDT"}]
*/
//@version=3
//study(title="Strat CCI EMA scalping", shorttitle="EMA-CCI-strat", overlay=true)
strategy("Strat CCI EMA scalping", shorttitle="EMA-CCI-strat", overlay=true)
exponential = input(true, title="Exponential MA")
// the risk management inputs
inpTakeProfit = input(defval = 1000, title = "Take Profit", minval = 0)
inpStopLoss = input(defval = 200, title = "Stop Loss", minval = 0)
inpTrailStop = input(defval = 200, title = "Trailing Stop Loss", minval = 0)
inpTrailOffset = input(defval = 0, title = "Trailing Stop Loss Offset", minval = 0)
// === RISK MANAGEMENT VALUE PREP ===
// if an input is less than 1, assuming not wanted so we assign 'na' value to disable it.
useTakeProfit = inpTakeProfit >= 1 ? inpTakeProfit : na
useStopLoss = inpStopLoss >= 1 ? inpStopLoss : na
useTrailStop = inpTrailStop >= 1 ? inpTrailStop : na
useTrailOffset = inpTrailOffset >= 1 ? inpTrailOffset : na
src = close
ma10 = exponential ? ema(src, 10) : sma(src, 10)
ma21 = exponential ? ema(src, 21) : sma(src, 21)
ma50 = exponential ? ema(src, 50) : sma(src, 50)
xCCI = cci(close, 200)
//buy_cond = cross(ma21, ma50) and ma10 > ma21 and (xCCI > 0)
//sell_cond = cross(ma21, ma50) and ma10 < ma21 and (xCCI < 0)
buy_cond = ma10 > ma21 and ma10 > ma50 and xCCI > 0
sell_cond = ma10 < ma21 and ma10 < ma50 and xCCI < 0
// === STRATEGY - LONG POSITION EXECUTION ===
enterLong() => buy_cond
exitLong() => ma10 < ma21
strategy.entry(id = "Long", long = true, when = enterLong()) // use function or simple condition to decide when to get in
strategy.close(id = "Long", when = exitLong()) // ...and when to get out
// === STRATEGY - SHORT POSITION EXECUTION ===
enterShort() => sell_cond
exitShort() => ma10 > ma21
strategy.entry(id = "Short", long = false, when = enterShort())
strategy.close(id = "Short", when = exitShort())
// === STRATEGY RISK MANAGEMENT EXECUTION ===
// finally, make use of all the earlier values we got prepped
//strategy.exit("Exit Long", from_entry = "Long", profit = useTakeProfit, loss = useStopLoss, trail_points = useTrailStop, trail_offset = useTrailOffset)
//strategy.exit("Exit Short", from_entry = "Short", profit = useTakeProfit, loss = useStopLoss, trail_points = useTrailStop, trail_offset = useTrailOffset)
//longCondition = buy_cond
//if(longCondition)
// strategy.entry("Long", strategy.long)
// strategy.exit("Close Long", "Long", when = exitLong())
//shortCondition = sell_cond
//if(shortCondition)
// strategy.entry("Short", strategy.short)
// strategy.exit("Close Short", "Short", when = exitShort())
//plotshape(buy_cond, style=shape.flag, color=green, size=size.normal)
//plotshape(sell_cond, style=shape.flag, color=red, size=size.normal)
c1 = buy_cond==1 ? lime : sell_cond==1 ? red : #a3a3a3 // color
plot( ma10, color=red, style=line, title="10", linewidth=1)
plot( ma21, color=orange, style=line, title="21", linewidth=1)
plot( ma50, color=c1, style=line, title="50", linewidth=3)
//alertcondition(buy_cond, title = "Buy Condition", message = "Buy Condition Alert")
//alertcondition(sell_cond, title = "Sell Condition", message = "Sell Condition Alert")