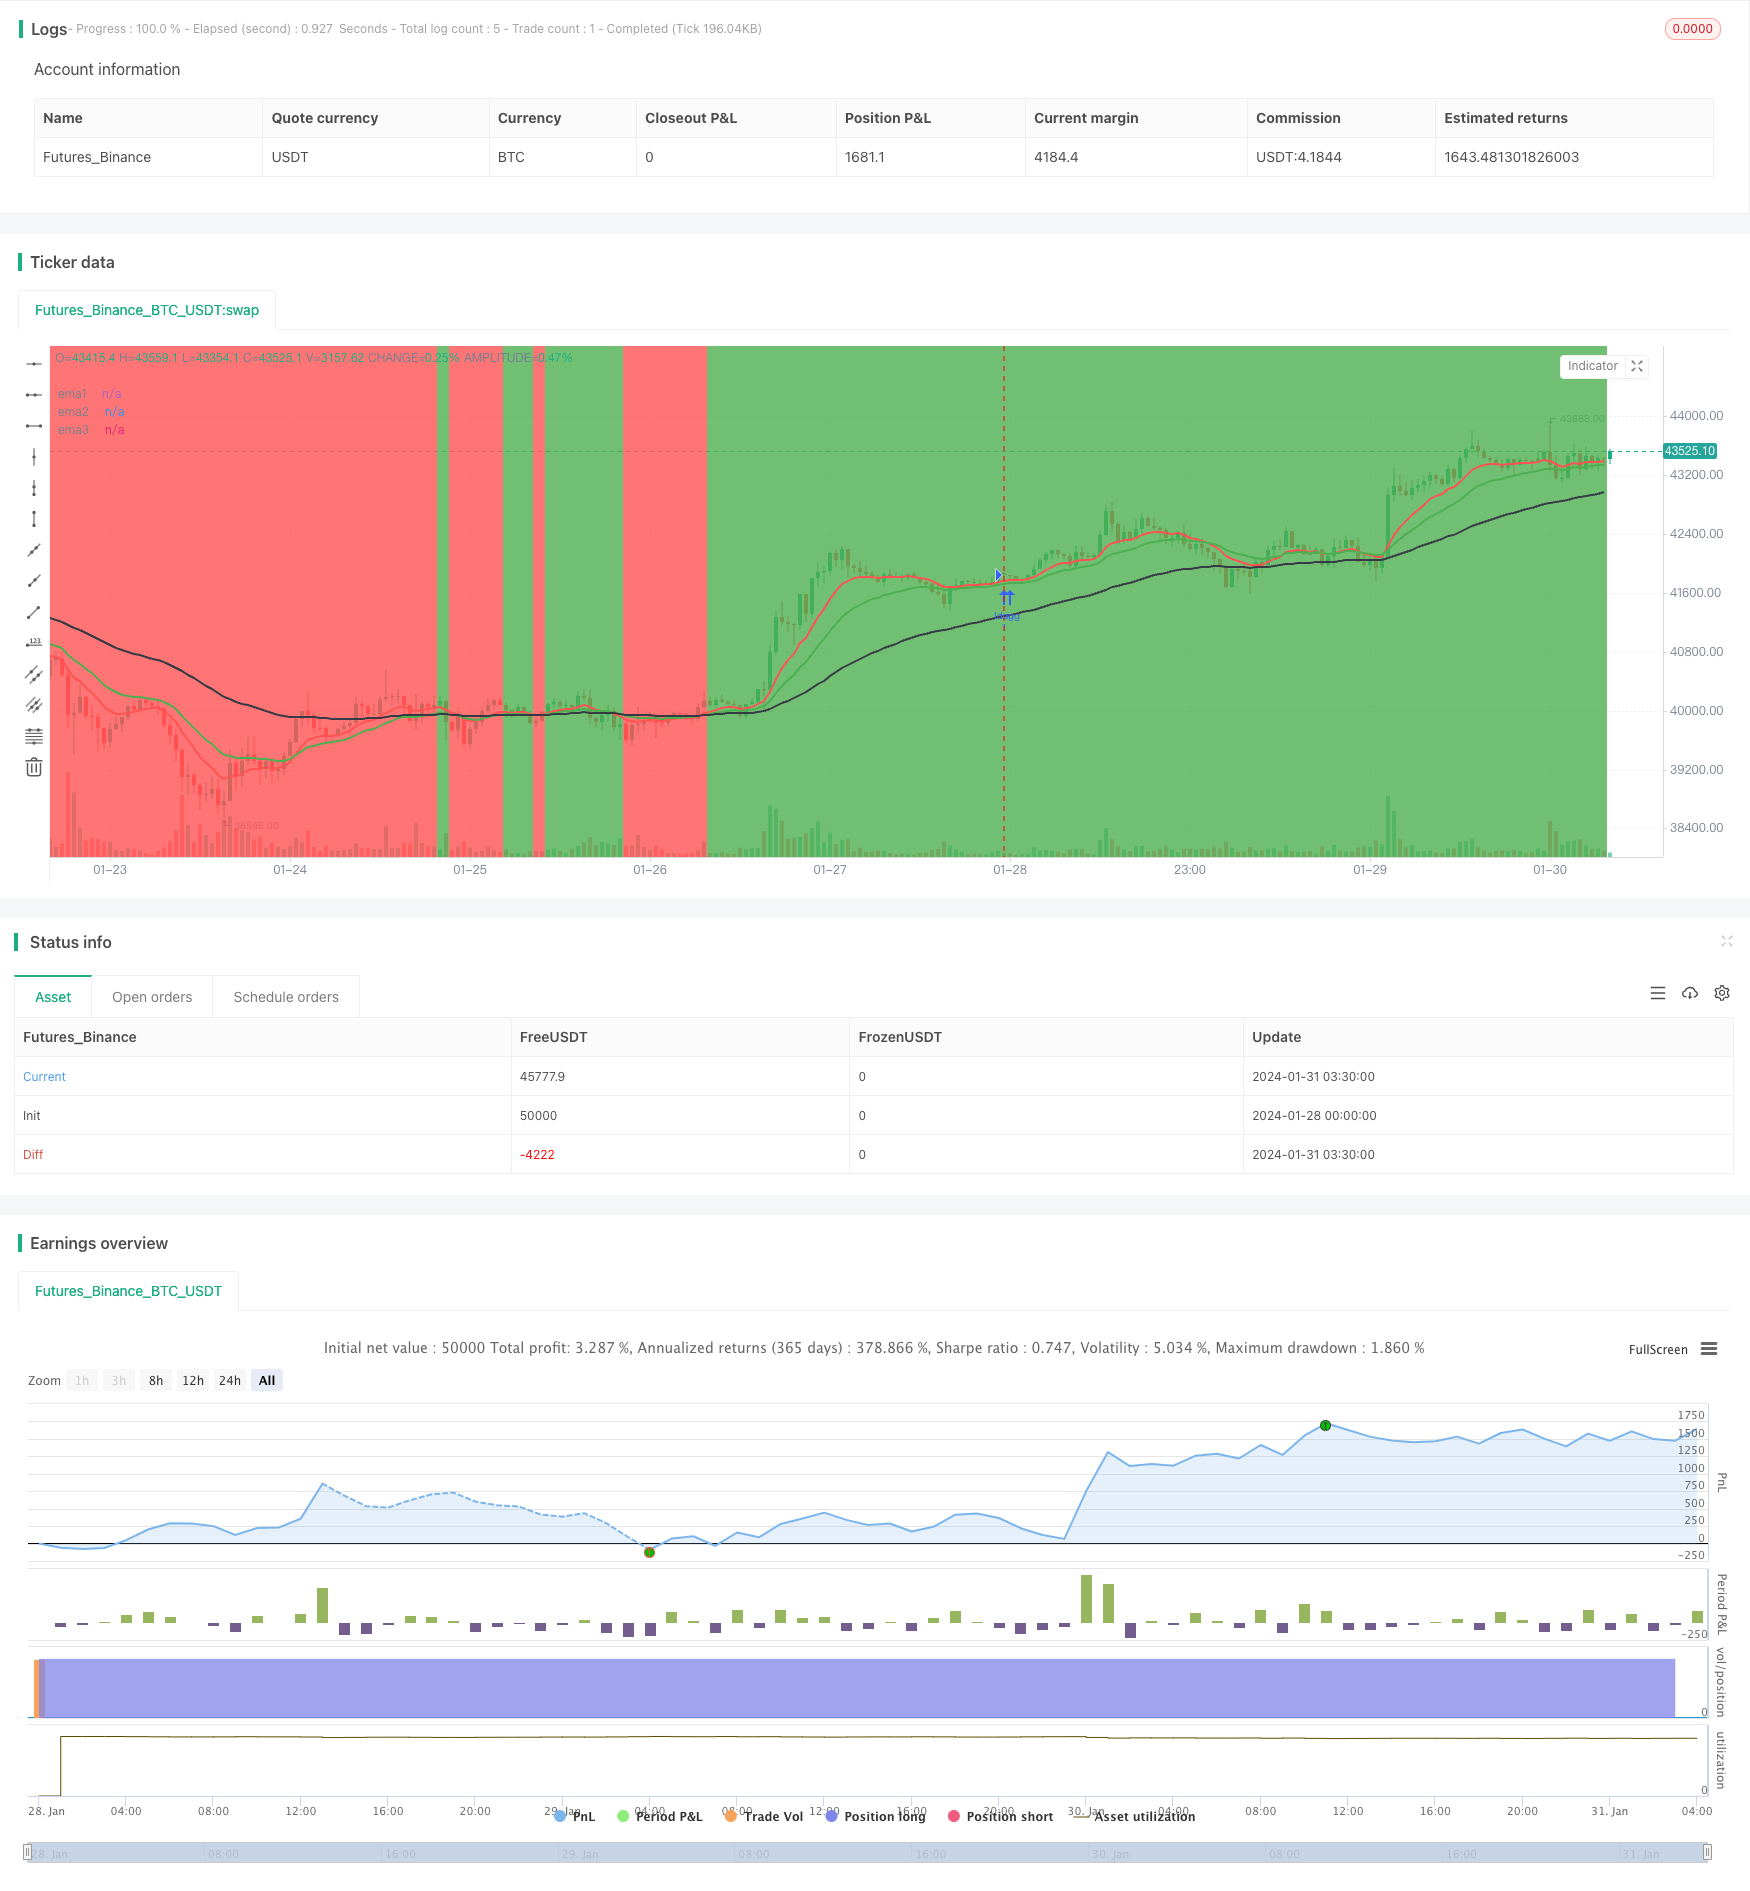
EMA移動平均に基づくトレンドフォロー戦略

概要
この戦略は,3つの異なる周期のEMA平均に基づいて,価格がEMA平均線上にあるかどうかを判断することによって,現在のトレンドの方向を判断する.短期EMA線上での長期EMA線を横切るときに買入シグナルを生成し,短期EMA線下での長期EMA線を横切るときに売り出せシグナルを生成する.この戦略は,トレンドを追跡して,トレンドが転じるときに平仓する.
戦略原則
この戦略は,10日線,20日線,50日線の3つのEMA平均を使用しています.判断ルールは以下の通りです.
10日目EMAと20日目EMAが50日目EMAの上で同時にあるとき,上昇傾向として定義される.
10日目EMAと20日目EMAが同時に50日目EMAの下にあるとき,下降傾向として定義される.
短期EMA線 (10日線と20日線) に長期EMA線 (50日線) を穿越すると買取信号が生成される.
短期EMA線 (10日線と20日線) を経由して長期EMA線 (50日線) を経由すると,売り信号が生成される.
上昇トレンドの多頭ポジションと下降トレンドの空頭ポジション;
トレンドが転じるときに,現在のシグナル方向のポジションを平らにする.
この戦略は,キャプチャ・プロフィット (capture profit) と,タイムリー・平仓 (Temporary Pleave) で収益をロックする方法で,交代的に多空操作を行う.
優位分析
この戦略の利点は以下の通りです.
- 規則はシンプルで明快で,理解し,実行しやすい.
- 短期的な市場の波動から逃れるために,EMAの平均値を使ってトレンドの方向を判断する.
- 市場を拡大しないように,トレンドを追跡し,時間内に平仓を進めること.
- 予想をせずにトレンドを追跡し,勝利率が高い.
リスク分析
この戦略にはいくつかのリスクがあります.
- 市場を整理する際には,EMAの平均値の間には,複数の突破が発生しやすいため,しばしば平仓を打つことで取引コストが引き出される可能性があります.
- 取引が空飛ぶと,EMAが判断するトレンドの効果が影響され,好ましい開場機会が逃される可能性がある.
リスクは以下の方法で最適化できます.
- EMAの間隔が小さい場合,ポジション開設のルールは適切に緩和され,過度に頻繁な取引を避けることができます.
- 他の指標と組み合わせてトレンドを決定し,EMAが不有効と判断する事態を回避する.
最適化の方向
この戦略は以下の方向から最適化できます.
パラメータ最適化.異なるEMA周期のパラメータの組み合わせをテストして最適なパラメータを見つけることができる.
取引コストの最適化. ポジション開設規則の適切な最適化,不必要な頻繁な取引の削減.
ストップ・ローズ戦略の最適化. 合理的なストップ・ローズレベルを設定し,単一損失を制御する.
他の指標と組み合わせる.MACD,KDJなどの他の指標を補助判断として使用し,入場時間を最適化する.
要約する
この戦略は全体的に比較的シンプルで実用的である。 EMA を利用してトレンドの走行方向を判断し,適切な止損戦略を併せて,リスクを効果的に制御することができる。 同時に,いくつかの最適化スペースが存在し,パラメータ最適化,止損戦略,その他の指標などと組み合わせれば,この戦略の効果が大きく向上する余地がある。
/*backtest
start: 2024-01-28 00:00:00
end: 2024-01-31 04:00:00
period: 45m
basePeriod: 5m
exchanges: [{"eid":"Futures_Binance","currency":"BTC_USDT"}]
*/

// This source code is subject to the terms of the Mozilla Public License 2.0 at https://mozilla.org/MPL/2.0/
// © mattehalen

//@version=4
//study("EMA 10,20 59",overlay=true)
strategy("EMA 10,20 59",overlay=true)
infoBox     = input(true, title="infoBox", type=input.bool)
infoBox2    = input(false, title="infoBox2", type=input.bool)
BuySellSignal_Bool = input(false, title="Buy & SellSignal", type=input.bool)
infoBoxSize = input(title="infoBoxSize", defval=size.large, options=[size.auto, size.tiny, size.small, size.normal, size.large, size.huge])
ema1Value   = input(10)
ema2Value   = input(20)
ema3Value   = input(59)
maxLoss = input(3000)
ema1        = ema(close,ema1Value)
ema2        = ema(close,ema2Value)
ema3        = ema(close,ema3Value)
objcnt      = 0
buyTitle    = tostring(close[1])
myProfit    = float(0)

plot(ema1,title="ema1",color=color.red,linewidth=2)
plot(ema2,title="ema2",color=color.green,linewidth=2)
plot(ema3,title="ema3",color=color.black,linewidth=2)

Buytrend = (ema1 and ema2 > ema3) and (ema1[1] and ema2[1] > ema3[1])
BarssinceBuyTrend = barssince(Buytrend)
BarssinceSellTrend = barssince(not Buytrend)
closeAtBuyTrend = close[1]
bgcolor(Buytrend ? color.green : color.red,transp=70)

BuySignal = Buytrend and not Buytrend[1] and BuySellSignal_Bool

BuySignalOut = Buytrend and (crossunder(ema1,ema2)) and BuySellSignal_Bool
BarssinceBuy = barssince(BuySignal)
bgcolor(BuySignal ? color.green : na , transp=30)
bgcolor(BuySignalOut ? color.black : na , transp=30)
plot(BarssinceBuy,title="BarssinceBuy",display=display.none)


SellSignal = not Buytrend and Buytrend[1] and BuySellSignal_Bool
SellSignalOut = not Buytrend and (crossover(ema1,ema2)) and BuySellSignal_Bool
BarssinceSell = barssince(SellSignal)
bgcolor(SellSignal ? color.red : na , transp=30)
bgcolor(SellSignalOut ? color.black : na , transp=30)
plot(BarssinceSell,title="BarssinceSell",display=display.none)


buyProfit   = float(0)
cntBuy      =0
sellProfit  = float(0)
cntSell     =0
buyProfit   := Buytrend and not Buytrend[1]? nz(buyProfit[1]) + (close[BarssinceBuyTrend[1]]-close) : nz(buyProfit[1])
cntBuy      := Buytrend and not Buytrend[1]? nz(cntBuy[1]) + 1: nz(cntBuy[1])
sellProfit  := not Buytrend and Buytrend[1]? nz(sellProfit[1]) + (close-close[BarssinceSellTrend[1]]) : nz(sellProfit[1])
cntSell     := not Buytrend and Buytrend[1]? nz(cntSell[1]) + 1 : nz(cntSell[1])
totalProfit = buyProfit + sellProfit

// if (Buytrend and not Buytrend[1] and infoBox==true)
//     l = label.new(bar_index - (BarssinceBuyTrend[1]/2), na,text="Close = " + tostring(close) + "\n" + "Start = "+tostring(close[BarssinceBuyTrend[1]]) + "\n" + "Profit = "+tostring(close[BarssinceBuyTrend[1]]-close) ,style=label.style_labelup, yloc=yloc.belowbar,color=color.red,size=infoBoxSize)
// if (not Buytrend and Buytrend[1] and infoBox==true)
//     l = label.new(bar_index - (BarssinceSellTrend[1]/2), na,text="Close = " + tostring(close) + "\n" + "Start = "+tostring(close[BarssinceSellTrend[1]]) + "\n" + "Profit = "+tostring(close-close[BarssinceSellTrend[1]]) ,style=label.style_labeldown, yloc=yloc.abovebar,color=color.green,size=infoBoxSize)

// if (BuySignalOut and not BuySignalOut[1] and infoBox2==true)
// //    l = label.new(bar_index - (BarssinceBuy[0]/2), na,text="Close = " + tostring(close) + "\n" + "Start = "+tostring(close[BarssinceBuy[0]]) + "\n" + "Profit = "+tostring(close-close[BarssinceBuy[0]]) ,style=label.style_labelup, yloc=yloc.belowbar,color=color.purple,size=infoBoxSize
//     l = label.new(bar_index, na,text="Close = " + tostring(close) + "\n" + "Start = "+tostring(close[BarssinceBuy[0]]) + "\n" + "Profit = "+tostring(close-close[BarssinceBuy[0]]) ,style=label.style_labelup, yloc=yloc.belowbar,color=color.lime,size=infoBoxSize)
// if (SellSignalOut and not SellSignalOut[1] and infoBox2==true)
// //    l = label.new(bar_index - (BarssinceSell[0]/2), na,text="Close = " + tostring(close) + "\n" + "Start = "+tostring(close[BarssinceSell[0]]) + "\n" + "Profit = "+tostring(close[BarssinceSell[0]]-close) ,style=label.style_labeldown, yloc=yloc.abovebar,color=color.purple,size=infoBoxSize)
//     l = label.new(bar_index, na,text="Close = " + tostring(close) + "\n" + "Start = "+tostring(close[BarssinceSell[0]]) + "\n" + "Profit = "+tostring(close[BarssinceSell[0]]-close) ,style=label.style_labeldown, yloc=yloc.abovebar,color=color.fuchsia,size=infoBoxSize)


// l2 = label.new(bar_index, na, 'buyProfit in pip = '+tostring(buyProfit)+"\n"+  'cntBuy = '+tostring(cntBuy) +"\n"+  'sellProfit in pip = '+tostring(sellProfit)+"\n"+  'cntSell = '+tostring(cntSell) +"\n"+  'totalProfit in pip = '+tostring(totalProfit)     ,
//   color=totalProfit>0 ? color.green : color.red,
//   textcolor=color.white,
//   style=label.style_labeldown, yloc=yloc.abovebar,
//   size=size.large)

// label.delete(l2[1])


//--------------------------------------------------
//--------------------------------------------------
if (Buytrend)
    strategy.close("short", comment = "Exit short")
    strategy.entry("long", true)
    strategy.exit("Max Loss", "long", loss = maxLoss)

//if BuySignalOut
   // strategy.close("long", comment = "Exit Long")
if (not Buytrend)
    // Enter trade and issue exit order on max loss.
    strategy.close("long", comment = "Exit Long")
    strategy.entry("short", false)
    strategy.exit("Max Loss", "short", loss = maxLoss)
//if SellSignalOut
    // Force trade exit.
    //strategy.close("short", comment = "Exit short")

//--------------------------------------------------
//--------------------------------------------------
//--------------------------------------------------