マルチタイムフレーム移動平均交差戦略

概要
マルチタイムフレーム移動平均クロスオーバー戦略 (Multi Timeframe Moving Average Crossover Strategy) は,異なる時間周期の移動平均の間の交差信号を利用してトレンド方向を判断するアルゴリズム取引戦略である.この戦略は,トレンド指標,運動指標,波動率指標の組み合わせを総合的に利用し,戦略信号をより信頼性のあるものにする.
戦略原則
この戦略は,異なる周期のCCI指標を計算して市場のトレンド方向を判断し,MACD指標と組み合わせて金叉死叉信号を探し,最後にATR指標を使用してストップ・ロスの位置を設定し,低買い高売りを実現する.
具体的には,まず20周期のCCI指標を計算し,その正負に基づいて市場動向を判断する.次に,MACD指標の急減平均線が交差するかどうかを計算し,買入シグナルが生成されるかどうかを判断する.次に,ATR指標を使用して,トラッキングストップ・ロスの仕組みを生成し,さらに利益をロックする.最後に,上記の複数の指標のシグナルを統合して,最終的な買出戦略シグナルを生成する.
戦略的優位性
-
複数の指標の組み合わせにより,信号の精度が向上する
この戦略は,CCI,MACD,ATRの3つの指標の組み合わせを使用し,市場の傾向,運動,変動率を総合的に判断し,戦略信号をより正確かつ信頼性のあるものにします.
-
マルチタイムフレーム分析,市場のペース把握
異なる周期のCCIを使用して市場の全体的な動きを判断し,高周期MACDと連携して低買い高売りノードを探し,市場のより大きなトレンドリズムを把握することができる.
-
ATR 障害追跡 リスク管理
ATR指標によって生成されるストップ・ロスは,市場の変動率に応じて合理的なストップ・ロスを設定でき,ストップ・ロスを追跡する機能を持ち,戦略のリスクを十分に制御できます.
戦略リスク
-
パラメータの最適化スペースは限られています.
この策略のパラメータの調整スペースは,効果の限界に達しやすいので,策略効果のさらなる向上を制限する.
-
複数の指標の組み合わせにより,計算の負荷が増加
策略は複数の指標を用いて組み合わせ算算を行うため,策略の計算負荷を一定程度に増加させる.高周波取引ではカートン問題が発生する可能性がある.
-
信号は頻繁で,リスク管理は限られている.
策略信号はより頻繁に発生し,リスク管理は主にATR指標のストップ・トラッキングに依存し,極端な状況に対するリスク管理は不完全である.
戦略の最適化
-
機械学習アルゴリズムによるパラメータ最適化効率の向上
機械学習による超パラメータ最適化アルゴリズム (ベイエス最適化,遺伝的アルゴリズムなど) を使って,パラメータ調整をより賢く効率的に行うことができます.
-
機能的な指標を増やし,戦略の弾力性を高める
戦略の適応性や強<unk>性を高めるために,波動率指標,量能指標,感情指標などの他の機能的指標を追加することを検討することができます.
-
リスク管理モジュールを強化し,リスク管理戦略を強化
より科学的な止損原理を設計したり,特定のポジション制御や資金管理モジュールを追加したりすることで,極端な状況のリスクをよりよく防ぎ,戦略の安定性を保証することができる.
要約する
多時間枠跨均線戦略は,CCI,MACD,ATRの3大指標の組み合わせを用いることで,より信頼性の高いトレンド判断と高効率のリスク管理を実現する.この戦略は,トレンド,動量,波動率の3次元を総合的に考慮し,信号正確性が高く,市場のペースを把握し,リスクを効果的に制御する利点がある.もちろん,戦略には,一定のパラメータ最適化スペース,限られた計算負荷の大きさ,およびリスク管理を向上させる問題なども存在する.より多くの指標を導入し,より優れたパラメータ最適化手段を適用し,より強力なリスク管理モジュールを設計することにより,この戦略はさらに向上させ,最適化することができる.
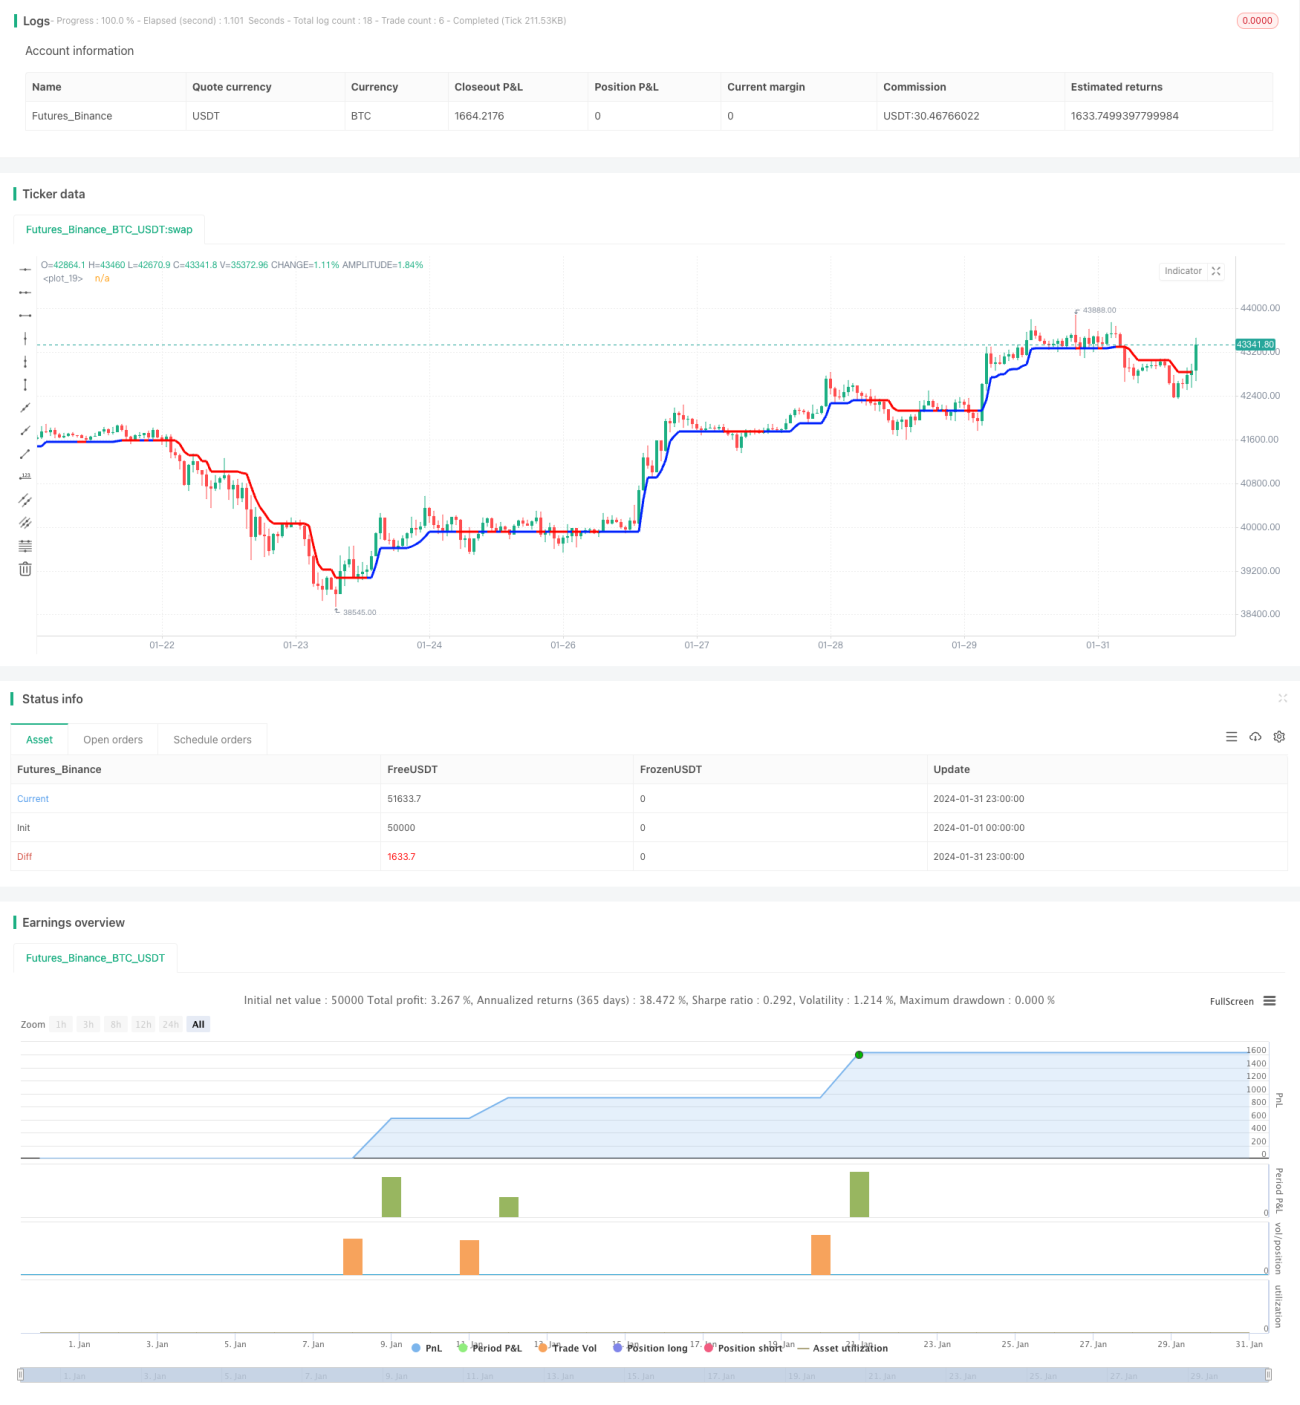
/*backtest
start: 2024-01-01 00:00:00
end: 2024-01-31 23:59:59
period: 1h
basePeriod: 15m
exchanges: [{"eid":"Futures_Binance","currency":"BTC_USDT"}]
*/

//@version=5
strategy('smplondonclinic Strategy', shorttitle='SMPLC Strategy', overlay=true, pyramiding = 0, process_orders_on_close = true, default_qty_type = strategy.percent_of_equity, default_qty_value = 100)

direction = input.string(title='Entry Direction', defval='Long', options=['Long', 'Short', 'Both'],group = "Strategy Entry Direction")- 1