MACD定量戦略 - ダブルクロス移動平均ブレイクスルー戦略
概要
この戦略は,迅速な移動平均線と遅い移動平均線の差値を計算してMACD指標を形成し,その後,信号線を組み合わせて金融市場の傾向と超買い超売り領域を判断し,MACDと信号線が多頭フォークを形成し,同時に200日平均線より高い価格で多頭フォークを形成し,空頭フォークを形成し,同時に200日平均線より低い価格で空頭フォークを形成し,典型的なダブルフォーク平均線突破戦略に属します.
戦略原則
基本原理は,急速移動平均線と遅移動平均線の差値を計算してMACD指数を形成し,市場トレンドの方向を判断し,信号線を使用して超買い超売り領域を判断する.MACDと信号線が金叉を形成するときは多頭信号で,死叉を形成する時は空頭信号で空白する.同時に,価格と200日平均線の関係を組み合わせて,過信号を,価格が200日平均線より高い時のみ金叉に多頭する,価格が200日平均線より低い時のみ死叉に空頭する,そうして強気トレンド中の誤乱信号を回避する.
具体的には
- 速動平均線 ((12日EMA) を減算して,遅動平均線 ((26日EMA) を得るとMACD
- MACDの9日EMAは信号線を入手しました
- MACDの直方図は,信号線を引いた MACDの直方図が得られます.
MACD上の信号線を穿越し,MACDと信号線が同時に0以下であるとき,金叉に多信号し,MACDの下の信号線を穿越し,MACDと信号線が同時に0以上であるとき,死叉に空信号する.同時に,価格が200日平均線より高いときのみ金叉に多信号し,価格が200日平均線より低いときのみ死叉に空信号する.
戦略的優位性
- 二重指数判断を使用し,単一の指数判断の限界を回避し,信号の正確性を向上させる
- 価格と均線関係によるダブルフィルタリングを組み合わせて,強気なトレンドの誤差信号を避ける
- 参数最適化スペースが広く,平均線参数調整により異なる市場環境に対応できます.
- 保守的なパラメータ設定により,信号が少ないが,正確性が高い
- 簡単に理解し,実行できる戦略
戦略リスク
- 市場が急激に波動すると,指標判断が影響され,誤った信号が生じる.
- 平均線システムの遅滞は,戦略のタイミングに影響する
- 信号が少ないので,トレンドの機会を逃すのは簡単です.
- PARAMETERS 最適化には過度の最適化のリスクがある
- 撤回管理と退去防止の仕組みが改善される
平均周期を適当に短縮し,他の指標判断を加え,損失防止措置を加えることでリスクを軽減することができる.
戦略最適化の方向性
1.tested on different timeframes from 15m upto 1D, where optimal results where on 4H timeframe in terms of risk adjusted returns
2.optimize fast ma and slow ma so that macd represents cycle, I found 7-21 performs good for 15m chart
3.also tested hull moving average for MACD which gave good results
4.stoploss can also be trailed for better risk management
要約する
この戦略は,全体的に非常にシンプルで実用的で,二重指標判断と価格フィルタリングによって高確率の取引信号を生成し,マージナル・リターン率が高い.MACDのクラシックパラメータ群を使用し,過度に最適化されません.最適化スペースは広く,平均線パラメータ群を調整し,他の指標判断と止損措置を加えるなどの手段によって戦略のパフォーマンスをさらに向上させることができます.全体的に基本を踏まえた典型的な量化戦略です.
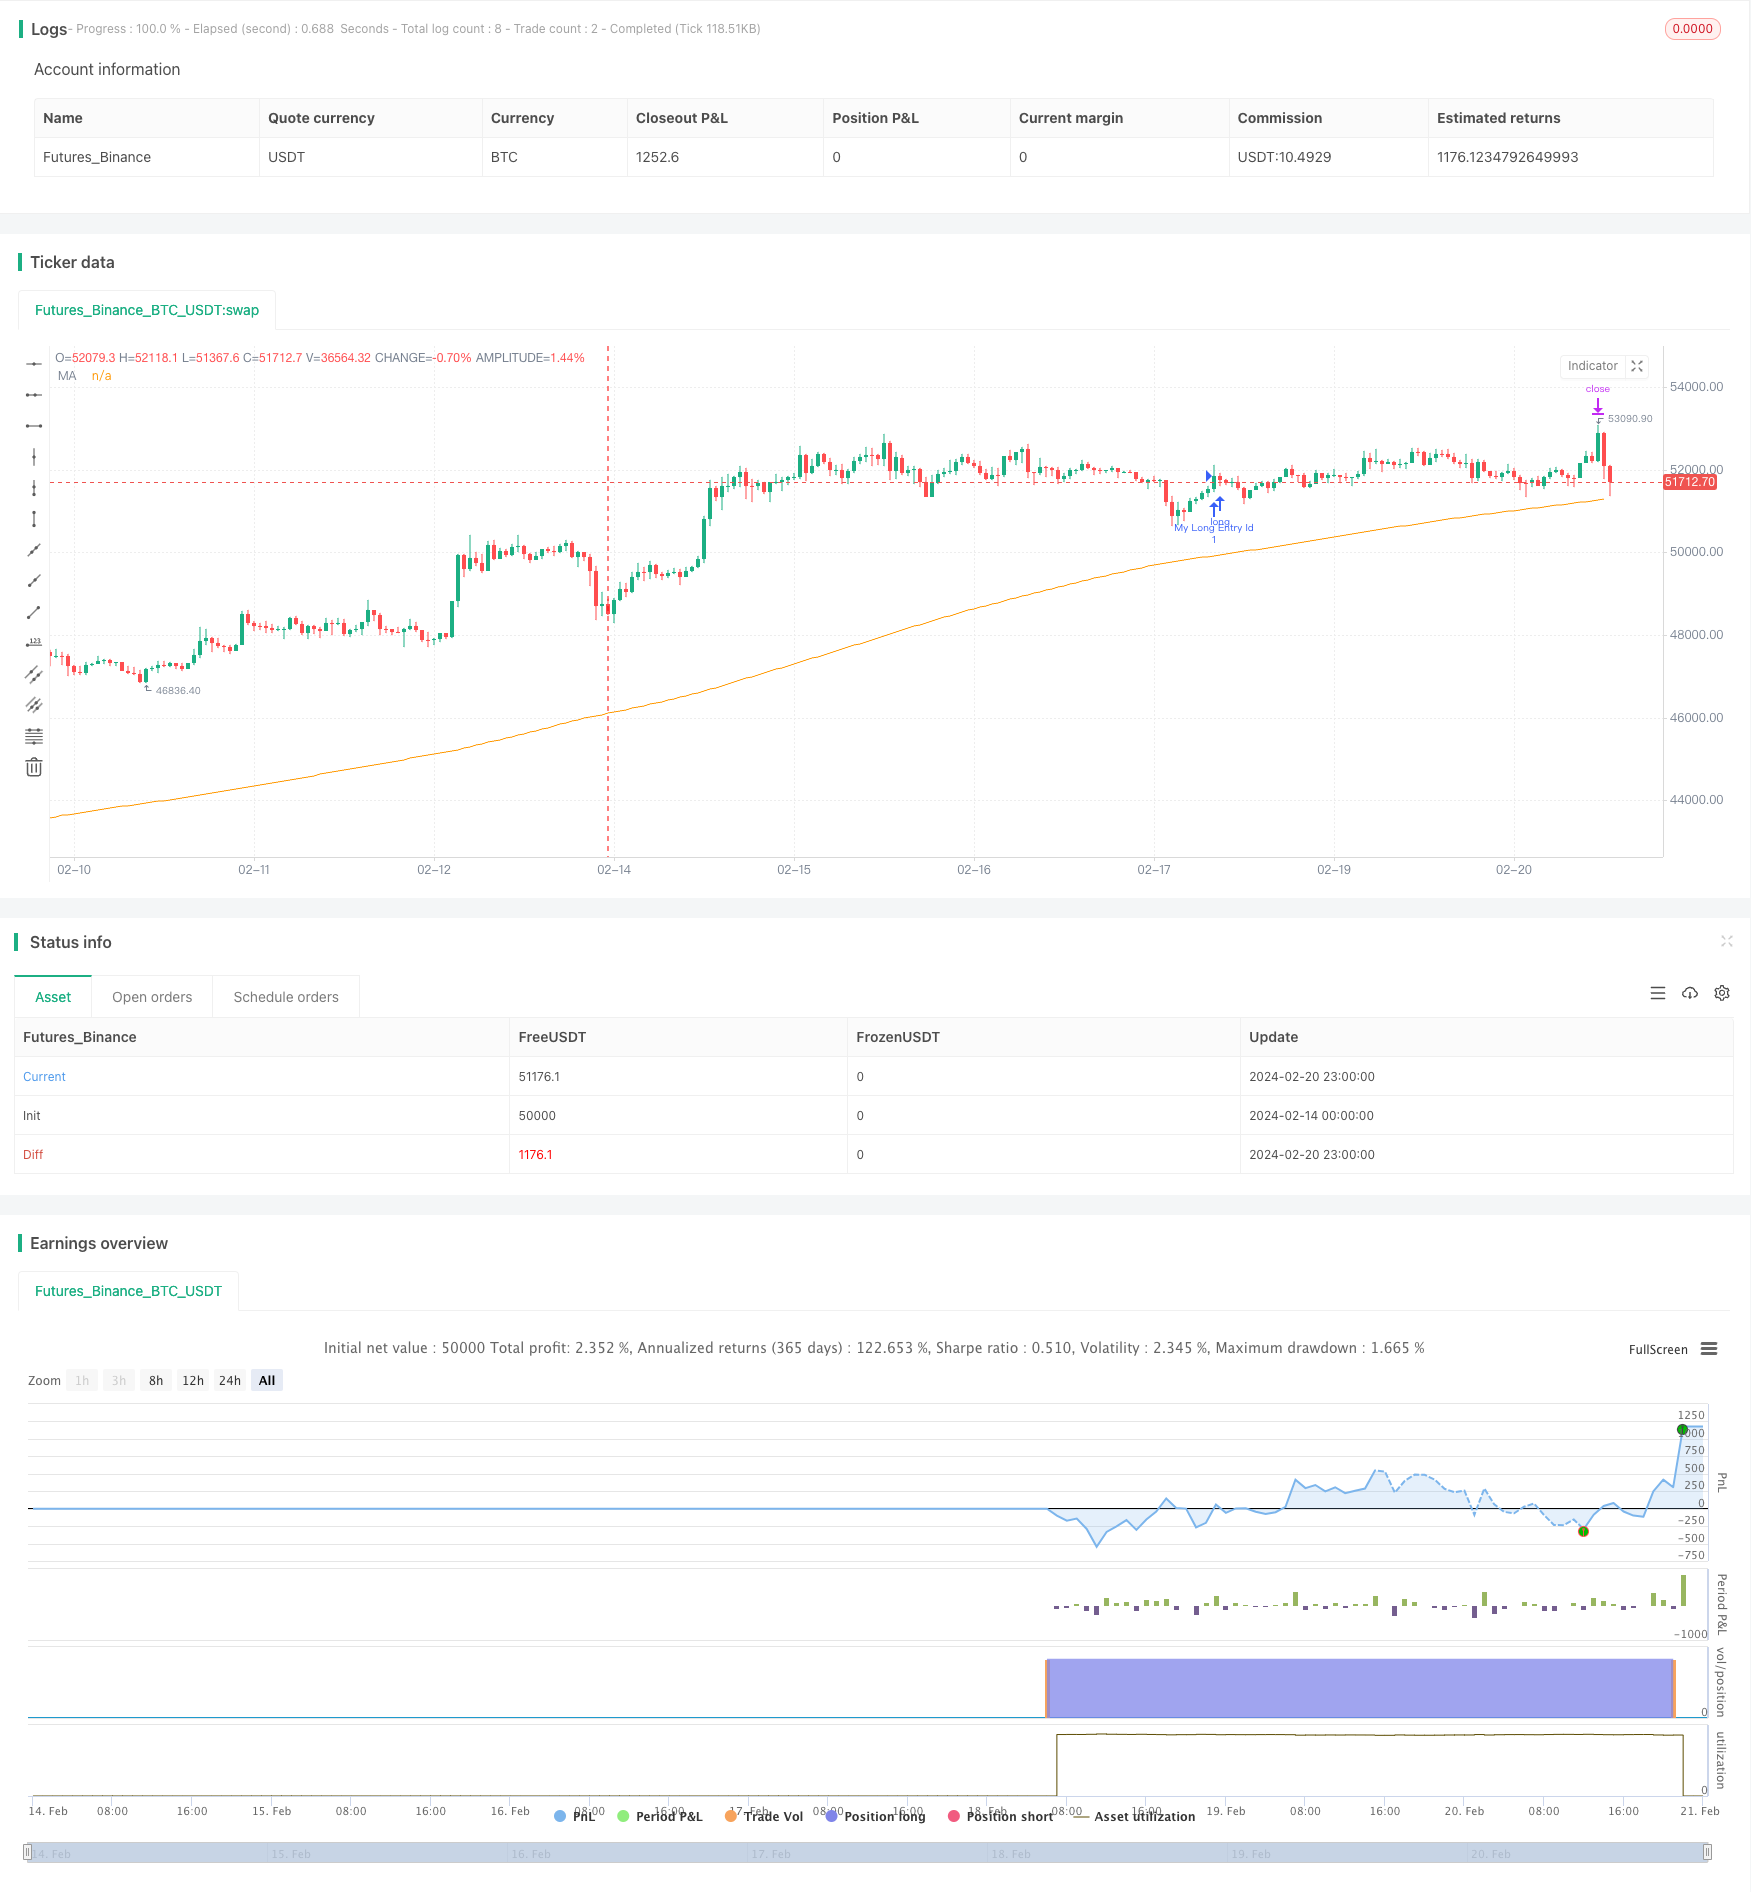
/*backtest
start: 2024-02-14 00:00:00
end: 2024-02-21 00:00:00
period: 1h
basePeriod: 15m
exchanges: [{"eid":"Futures_Binance","currency":"BTC_USDT"}]
*/

// This source code is subject to the terms of the Mozilla Public License 2.0 at https://mozilla.org/MPL/2.0/
// © Hurmun

//@version=4
strategy("Simple MACD strategy ", overlay=true, margin_long=100, margin_short=100)


fast_length = input(title="Fast Length", type=input.integer, defval=12)
slow_length = input(title="Slow Length", type=input.integer, defval=26)
src = input(title="Source", type=input.source, defval=close)
signal_length = input(title="Signal Smoothing", type=input.integer, minval = 1, maxval = 50, defval = 9)
sma_source = input(title="Simple MA (Oscillator)", type=input.bool, defval=false)
sma_signal = input(title="Simple MA (Signal Line)", type=input.bool, defval=false)
// Plot colors
col_grow_above = #26A69A
col_grow_below = #FFCDD2
col_fall_above = #B2DFDB
col_fall_below = #EF5350
col_macd = #0094ff
col_signal = #ff6a00
// Calculating
fast_ma = sma_source ? sma(src, fast_length) : ema(src, fast_length)
slow_ma = sma_source ? sma(src, slow_length) : ema(src, slow_length)
macd = fast_ma - slow_ma
signal = sma_signal ? sma(macd, signal_length) : ema(macd, signal_length)
hist = macd - signal


movinga2 = input(title="movinga 2", type=input.integer, defval=200)

movinga200 = sma(close, movinga2)

plot(movinga200, "MA", color.orange)
longCondition = crossover(macd, signal) and macd < 0 and signal < 0 and close > movinga200
if (longCondition)
    strategy.entry("My Long Entry Id", strategy.long)

shortCondition = crossunder(macd, signal) and macd > 0 and signal > 0 and close < movinga200
if (shortCondition)
    strategy.entry("My Short Entry Id", strategy.short)

shortProfitPerc = input(title="Short Take Profit (%)", minval=0.0, step=0.1, defval=2) / 100
longProfitPerc = input(title="Long Take Profit (%)", minval=0.0, step=0.1, defval=2) / 100

stoploss = input(title="stoploss in %", minval = 0.0, step=1, defval=2) /100

longStoploss = strategy.position_avg_price * (1 - stoploss)
longExitPrice  = strategy.position_avg_price * (1 + longProfitPerc)

shortExitPrice = strategy.position_avg_price * (1 - shortProfitPerc)
shortStoploss = strategy.position_avg_price * (1 + stoploss)

if (strategy.position_size > 0 )
    strategy.exit(id="XL TP", limit=longExitPrice, stop=longStoploss)


if (strategy.position_size < 0 )
    strategy.exit(id="XS TP", limit=shortExitPrice, stop=shortStoploss)