モメンタムベースのブレイクアウト戦略

概要
動力突破戦略は,市場の動力を追跡するトレンド戦略である.これは,市場が現在上昇傾向にあるか下落傾向にあるかを判断する複数の指標を組み合わせ,重要な抵抗点を突破するときに多額のポジションを立て,重要なサポート点を突破するときに空いたポジションを立てている.
戦略原則
この戦略は,主に,複数の長期 Donchian チャンネルを計算することによって,市場動向と鍵値の判断を行う.具体的には,価格が長期 Donchian チャンネルを突破すると,上昇傾向として判断し,その基礎で,年内の新高,移動平均の方向的な並びなどのフィルタリング条件を組み合わせて,複数の信号を発信する.価格が長期 Donchian チャンネルを突破すると,下降傾向を判断するために,年内の新低などのフィルタリング条件を組み合わせて,空信号を発信する.
ポジションの退出に関して,この戦略は2つの選択肢を提供します:固定キャンセルラインと追跡ストップ. 固定キャンセルラインは,20日 Donchian通路のようなより短い周期に基づいてストップポイントを設定します. 追跡ストップは,ATR 値に基づいて毎日の計算浮動ストップです.
優位分析
この戦略は,トレンド判断とブレイク操作を組み合わせて,市場における短線の方向的な機会を効果的に捕捉することができる.単一の指標と比較して,複数のフィルタリング条件を総合的に適用し,一部の偽ブレイクをフィルタリングして,入力信号の質を向上させることができる.さらに,ストップ・ストーピング戦略の適用は,その耐久性を強くし,短期的な逆転であっても,損失を効果的に制御することができる.
リスク分析
この戦略の主なリスクは,市場が急激に波動し,ストロップがポジション退出を誘発することにある.このとき,市場が急速に逆転した場合,チャンスを逃す可能性がある.また,複数のフィルタ条件の適用は,戦略のポジション保持頻度を減らすために,いくつかのチャンスをフィルタリングする.
リスクを軽減するために,ATR値を適切に調整したり,ドンキアン軌道間隔を拡大したりすることで,ストップダメージが突破される可能性を減らすことができる。また,部分的なフィルタリング条件を低下させたり,キャンセルしたりして,エントリー頻度を高めることもできるが,リスクも増加する。
最適化の方向
この戦略は以下の点で最適化できます.
- Donchian 経路の長さを最適化して,最適なパラメータの組み合わせを探します.
- 移動平均を<unk>波指数として使ってみましょう.
- ATRの倍数調整または固定ポイント数ストップに変更
- MACDなどのトレンド判断指標を追加します.
- 判断の窓間を最適化する
異なるパラメータをテストすることで,最適なパラメータの組み合わせを見つけ,リスクと利益のバランスを取ることができます.
要約する
この戦略は,複数の指標を総合的に使ってトレンドの方向を判断し,キーポイントの突破時に取引シグナルを発する.そのストップダストメカニズムは,この戦略を強力なリスク管理能力にもする.この戦略は,最適化パラメータの設定によって,安定した余剰収益を達成することができる.それは,市場について明確な判断がないが,トレンドを追跡したい投資家には適している.
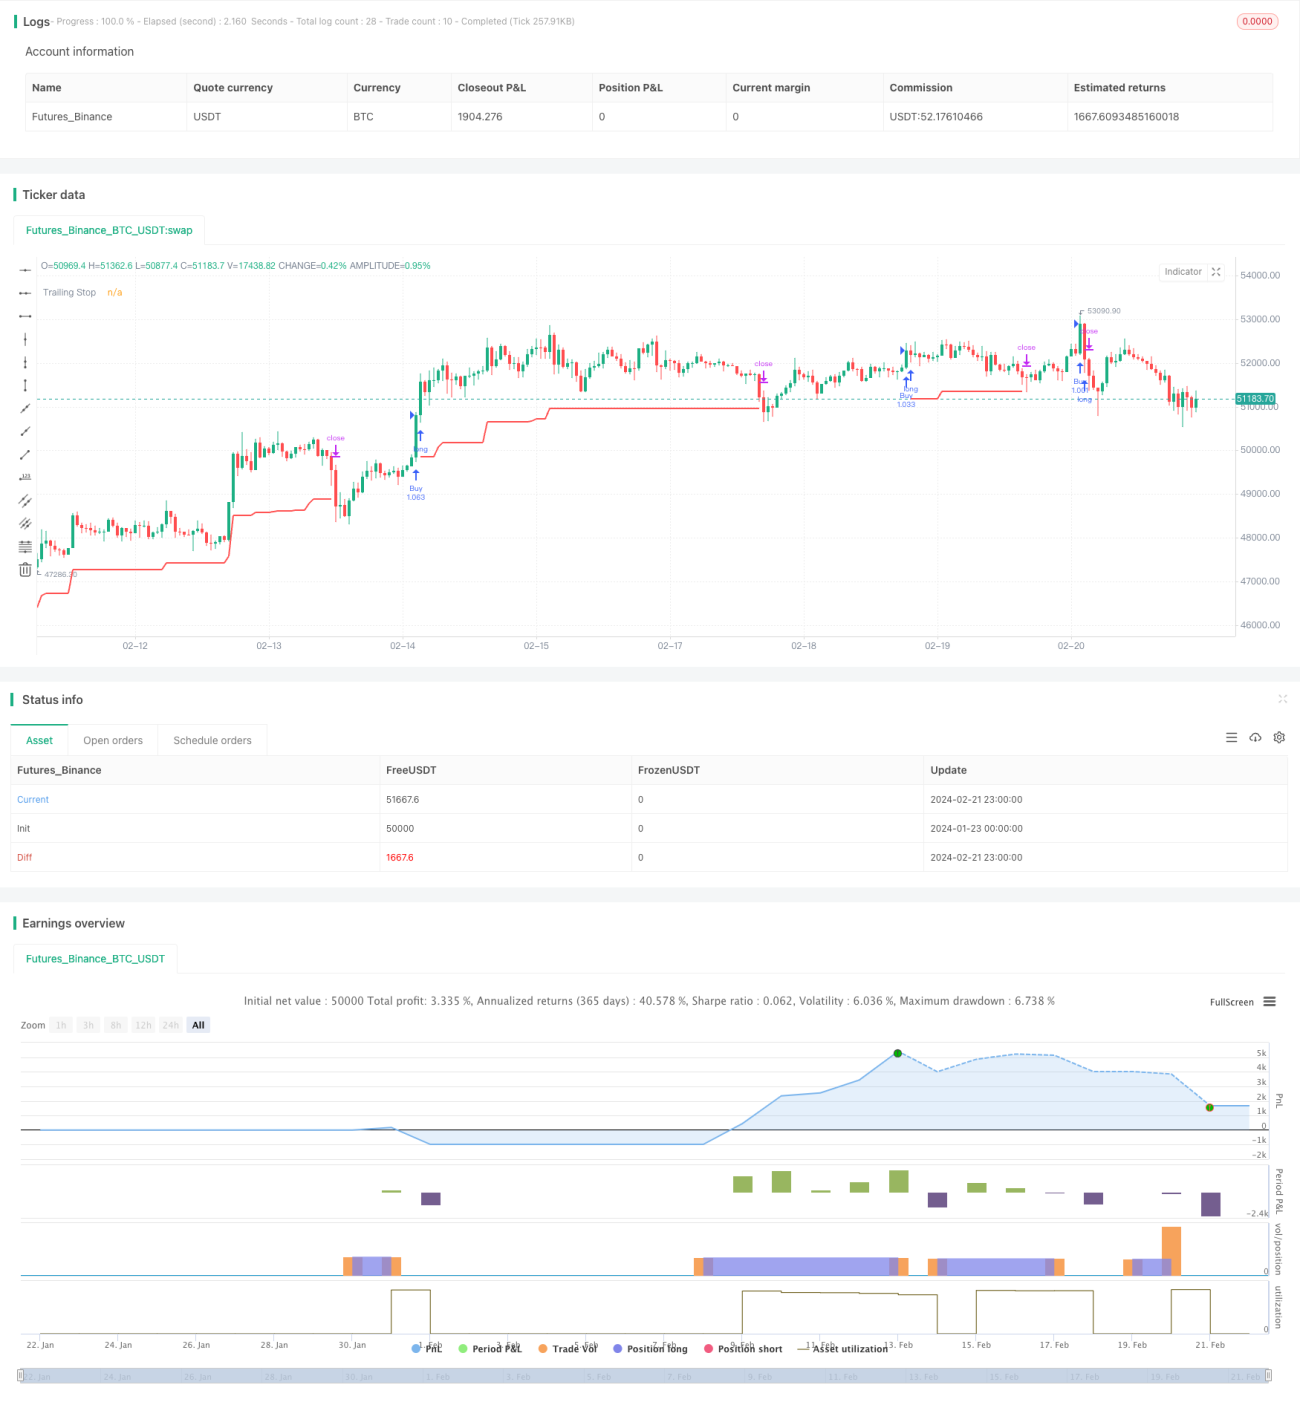
/*backtest
start: 2024-01-23 00:00:00
end: 2024-02-22 00:00:00
period: 1h
basePeriod: 15m
exchanges: [{"eid":"Futures_Binance","currency":"BTC_USDT"}]
*/

// This source code is subject to the terms of the Mozilla Public License 2.0 at https://mozilla.org/MPL/2.0/
// © HeWhoMustNotBeNamed

//@version=4- 1