EMA-MACD-SuperTrend-ADX-ATR マルチインジケーター取引シグナル戦略
作成日:
2024-03-29 15:41:29
最終変更日:
2024-03-29 15:41:29
コピー:
19
クリック数:
1295
1
フォロー
1750
フォロワー
概要
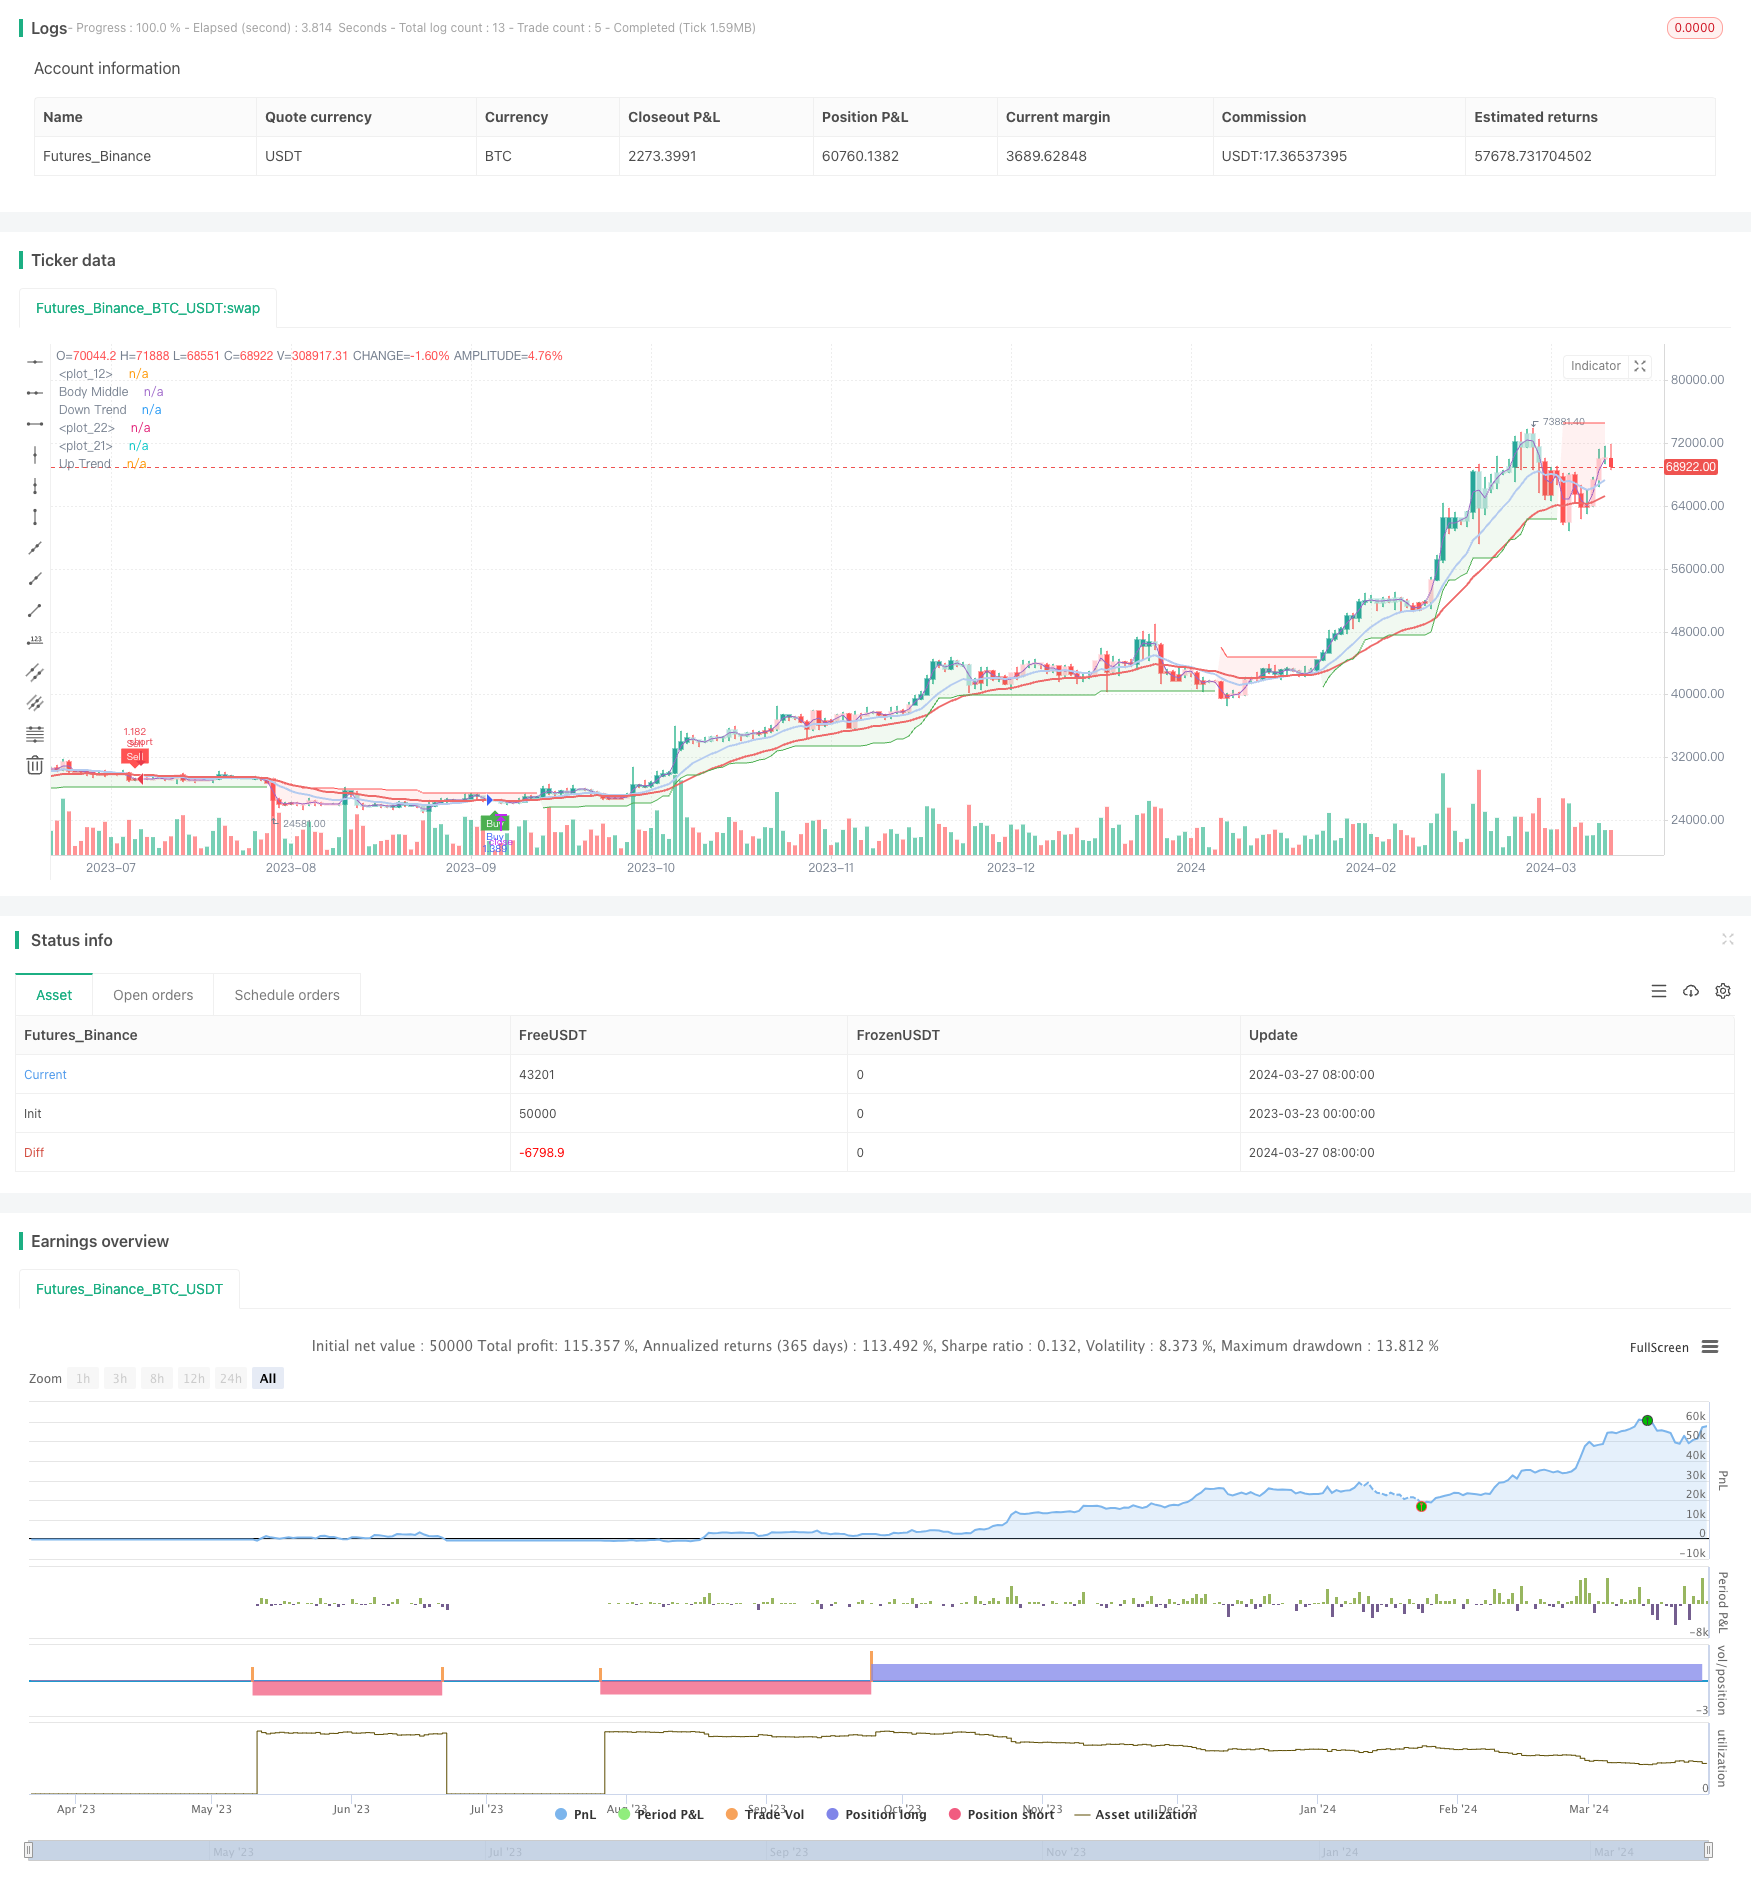
この戦略は,指数移動平均 ((EMA),移動平均収束分散指数 ((MACD),スーパートレンド,平均方向指数 ((ADX) と平均リアル波幅 ((ATR) を含む複数の技術指標を総合的に使用し,これらの指標の組み合わせを使用して,市場傾向,波動性,取引シグナルを判断し,暗号通貨取引で良いリターンを得ることを期待します. この戦略は,異なる指標の優位性を利用し,トレンド判断,震動判断,リスク管理などのバランスを取ることを目指し,トレーダーに信頼できる取引シグナルを提供します.
戦略原則
- 12日と26日EMAの交差をトレンド判断の基礎として使用し,12日EMAが26日EMAを横切るときは上昇傾向を示し,逆に下降傾向を示します.
- MACD指標を補助判断として使用し,MACD直線図が0より大きいときは,EMA多頭信号と組み合わせて開設し,MACD直線図が0より小さいときは,EMA空頭信号と組み合わせて開設する.
- ADX指標によって市場がトレンド状態にあるかどうかを判断する.ADXが15より大きいときは市場がトレンド期にあると考えられる.
- ATR指標を用いて市場の波動性を判断する.ATRが20日ATRの0.5倍以上であるとき,市場は高波動状態にあると考えられる.
- スーパートレンド指標をストップ条件として導入し,価格がスーパートレンドを下回ると多頭ポジションを平らにし,価格がスーパートレンドを突破すると空頭ポジションを平らにする.
- EMA,MACD,ADX,ATR条件を満たしたときに,多頭または空頭信号に基づいてポジションを開く.SuperTrendのストップ条件を触発したときに平定する.
戦略的優位性
- マルチ指標ポートフォリオ:この戦略は,複数の技術指標を用いて,トレンド,震動,リスク管理などの複数の次元から市場を分析し,取引信号の信頼性を向上させる.
- 傾向判断:EMAとMACDの組み合わせにより,戦略は市場の傾向の方向をよりよく判断し,取引決定の根拠を提供します.
- リスク管理: ADXとATRの指標を導入し,市場のトレンドの強さや波動性を判断し,取引リスクを一定程度に管理する.
- 止損メカニズム:SuperTrend指標を止損条件として使用し,取引の最大損失を効果的に制限し,取引資金を保護する.
- パラメータの柔軟性: 戦略の各指標のパラメータは,異なる市場状況と取引の種類に応じて,変化する市場環境に対応するために柔軟に調整することができます.
戦略リスク
- パラメータ最適化:この戦略は,EMA周期,MACDパラメータ,ADX値などの複数の指標とパラメータを扱う.これらのパラメータの選択は,戦略の効果に重要な影響を及ぼし,繰り返しパラメータ最適化とデビューが必要である.
- 市場適応性:この戦略は,変動する市場やトレンドの転換点のような特定の市場状況下で不十分なパフォーマンスを発揮し,その時に戦略は間違った取引シグナルを発信する可能性があります.
- 滑点と取引コスト:この戦略は,高波動の市場でより頻繁な取引シグナルを生じ,戦略の収益に影響する高滑点と取引コストを引き起こす可能性があります.
- 回測の限界:この戦略の回測結果には一定の限界がある可能性があり,実際の取引における市場の状況が歴史的なデータと異なる可能性があり,戦略が実体での動作におけるパフォーマンスは,回測結果と完全に一致しない可能性があります.
戦略最適化の方向性
- 動的パラメータ最適化:異なる市場状況と取引品種に対応して,戦略の重要なパラメータを動的に最適化して,戦略の適応性と安定性を向上させる.
- 市場情緒指標の導入:既存の指標に基づいて,市場情緒を反映する指標の導入,例えばパニック指数 ((VIX)) など,市場情緒の定量分析を行い,取引決定を支援する.
- 改善した止損機構:スーパートレンドの止損の基礎に,移動止損,比率止損などの他の止損方法を導入し,止損の柔軟性と有効性を向上させる.
- ポジション管理の最適化:市場トレンドの強さ,波動性などの要因に応じて,ポジションの大きさを動的に調整し,トレンドが明確であるときにポジションを大きくし,震動する市場でポジションを小さくし,資金利用効率を向上させる.
- 多時間枠分析:日線,4時間線などの異なる時間枠の信号を組み合わせ,取引信号の複数の確認を行い,信号の信頼性を高める.
要約する
EMA-MACD-SuperTrend-ADX-ATRマルチ指標取引シグナル戦略は,複数の技術指標を総合的に使用する量化取引戦略である.EMA,MACD,ADX,ATRなどの指標の組み合わせにより,戦略は,トレンド,震動,リスク管理などの複数の次元から市場を分析することができ,トレーダーに信頼できる取引信号を提供します.この戦略の優点は,複数の指標の組み合わせ,傾向判断,リスク管理および止損メカニズムなどの側面にあります.しかしながら,パラメータ最適化,市場適応性,取引コストおよび回転制限などのリスクもあります.
ストラテジーソースコード
/*backtest
start: 2023-03-23 00:00:00
end: 2024-03-28 00:00:00
period: 1d
basePeriod: 1h
exchanges: [{"eid":"Futures_Binance","currency":"BTC_USDT"}]
*/

//@version=5
strategy("EMA-MACD-SuperTrend-ADX-ATR Strategy",
     overlay = true,
     initial_capital = 1000,
     default_qty_type = strategy.percent_of_equity,
     default_qty_value = 70)

//MACD
[macdLine, signalLine, hist] = ta.macd(close, 12, 26, 9)
//Plot Candlesticks
candlestickscolor = (hist >= 0 ? (hist[1] < hist ? #26A69A : #B2DFDB) : (hist[1] < hist ? #FFCDD2 : #FF5252))
plotcandle(open, high, low, close,
     color = candlestickscolor,
     bordercolor = candlestickscolor)

//EMA
ema12 = ta.ema(close, 12)
ema26 = ta.ema(close, 26)

//Plot EMA
plot(ema26, color= #EE6969, linewidth = 2)
plot(ema12, color= #B4CBF0, linewidth = 2)

//Average Directional Index (ADX) Calculation
trueRange = ta.rma(ta.tr, 14)
plusDM = ta.rma(math.max(high - high[1], 0), 14)
minusDM = ta.rma(math.max(low[1] - low, 0), 14)
plusDI = 100 * ta.rma(plusDM / trueRange, 14)
minusDI = 100 * ta.rma(minusDM / trueRange, 14)
adxValue = 100  *ta.rma(math.abs(plusDI - minusDI) / (plusDI + minusDI), 14)

//Trend Confirmation (ADX)
trending = adxValue > 15

//Volatility Filter (ATR)
atrValue = ta.atr(14)
volatility = atrValue > 0.5 * ta.atr(20)

//SuperTrend
atrlength = input.int(10, "ATR Length", step = 1)
factor = input.float(3, "Factor", step = 0.1)
[supertrend, direction] = ta.supertrend(factor, atrlength)
supertrend := barstate.isfirst ? na : supertrend

//Plot SuperTrend
uptrend = plot(direction < 0 ? supertrend : na,
     "Up Trend", color = color.green, style = plot.style_linebr, linewidth = 1)

downtrend = plot(direction > 0 ? supertrend : na,
     "Down Trend", color = color.red, style = plot.style_linebr, linewidth = 1)
bodymiddle = plot(barstate.isfirst ? na : (open + close)/2, "Body Middle", display = display.none)
fill(bodymiddle, uptrend,   color.new(color.green, 90), fillgaps = false)
fill(bodymiddle, downtrend, color.new(color.red,   90), fillgaps = false)

//Entry Conditions
longCondition = ta.crossover(ema12, ema26) and trending and volatility and hist > 0

shortCondition = ta.crossunder(ema12, ema26)  and trending and volatility and hist < 0

long_SL_Con = ta.crossunder(close, supertrend)

short_SL_Con = ta.crossover(close, supertrend)

//Plot Signal
plotshape(longCondition,
     title='Buy', text='Buy',
     location= location.belowbar,
     style=shape.labelup, size=size.tiny,
     color=color.green, textcolor=color.new(color.white, 0))

plotshape(shortCondition,
     title='Sell', text='Sell',
     location= location.abovebar,
     style=shape.labeldown, size=size.tiny,
     color=color.red, textcolor=color.new(color.white, 0))

//Backtest
start = timestamp(2020, 1, 1, 0, 0, 0)
end = timestamp(2024, 1, 1, 0, 0, 0)
backtestperiod = time >= start and time <= end

if longCondition and backtestperiod
    strategy.entry("Buy", strategy.long)

if long_SL_Con and backtestperiod
    strategy.close("Buy")

if shortCondition and backtestperiod
    strategy.entry("Sell", strategy.short)

if short_SL_Con and backtestperiod
    strategy.close("Sell")