モメンタムトレーディング: ダブル移動平均クロスオーバー戦略

1
Follow
1782
Followers
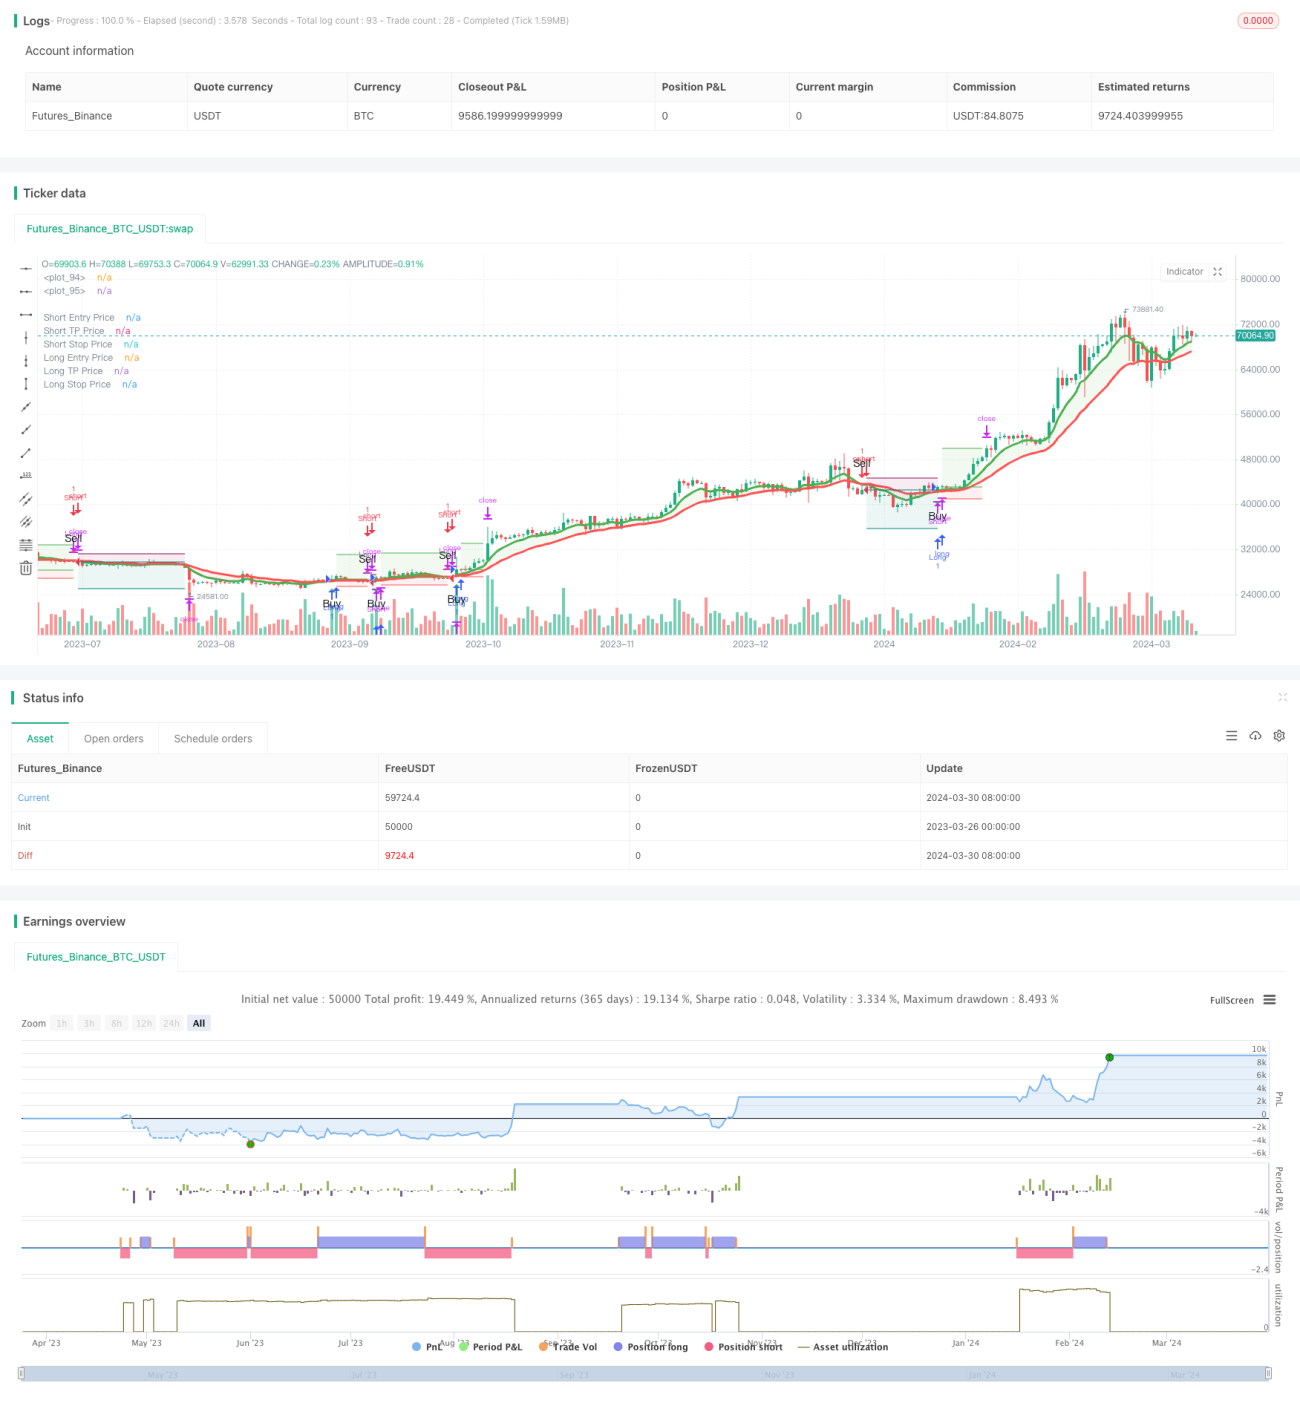
概要
この戦略は,8周期と21周期の指数移動平均 (((EMA) を用いて市場傾向の変化を識別する.より短い周期のEMAがより長い周期のEMAを下から横切るとき,買いの信号を生じ;逆に,より短い周期のEMAがより長い周期のEMAを上から横切るとき,売りの信号を生じする.この戦略は,さらにトレンドの逆転をさらに確認する信号として,3つの連続したより高い低値 (((HLL) と3つの連続したより低い高値 (((LLH) を組み合わせる.さらに,この戦略は,リスクを制御し,利潤をロックするために,ストップ・ロズとストップ・ストップのレベルを設定する.
戦略原則
- 主なトレンドの方向を識別するために,8周期と21周期のEMAを計算する.
- トレンドの逆転の早期信号として,3つの連続したより高い低点 ((HLL) と3つの連続したより低い高点 ((LLH) を識別する.
- 8周期EMAが下から21周期EMAを突破し,HLLの突破が発生すると,買入シグナルが生じます. 8周期EMAが上から21周期EMAを突破し,LLHの突破が発生すると,売出シグナルが生じます.
- リスク管理と利益のロックをするために,入場価格の5%のストップ・ローズレベルと入場価格の16%のストップ・ローズレベルを設定します.
- 逆転の信号が出ると,平仓を入れ,逆転してポジションを開きます.
戦略的優位性
- EMAと価格行動パターン ((HLLとLLH) を組み合わせてトレンドを確認し,信号の信頼性を高めます.
- リスクの管理と利益の確保に役立つ明確なストップ・ロズとストップ・ストップのレベルを設定します.
- 複数の時間枠と異なる市場に適用され,ある程度の普遍性があります.
- 論理が明確で,理解し,実行しやすい.
戦略リスク
- 波動的な市場では,頻繁に交差すると,誤信号が繰り返し発生し,損失を招く可能性があります.
- 固定のストップ・ロズとストップ・ストップレベルは,異なる市場環境に適応できない可能性があり,潜在的な機会コストやより大きな損失を引き起こす.
- 戦略は過去のデータに依存し,突発的な出来事や根本的な変化に対して適応性が低い可能性があります.
戦略最適化の方向性
- 変動率 (ATRなど) をベースにした自律的な止損と停止の仕組みを導入し,異なる市場状況に適した止損と停止のレベルを調整する.
- 取引量,相対強さ指数 (RSI) などの他の指標または要因と組み合わせて,信号をさらにフィルタリングし,信頼性を向上させる.
- パラメータ (EMA周期,ストップ・ストップ比率など) を最適化して,特定の市場または指標上で最適のパフォーマンスを示すパラメータの組み合わせを見つけます.
- ポジションサイジングなどのリスク管理策の導入を考慮し,単一取引のリスクの<unk>を制御する.
要約する
この戦略は,8サイクルと21サイクルEMAの交差を活用し,HLLとLLHの価格モデルを組み合わせて,トレンドの逆転を認識し,取引シグナルを生成する.明確なストップ・ストップル規則は,リスクを制御し,利益をロックするのに役立ちます.しかし,この戦略は,不安定な市場で偽のシグナルを生成し,固定ストップ・ストップのレベルも,異なる市場環境に適応できない可能性があります.さらなる改善のために,適応ストップ・ストップを導入し,他の指標を組み合わせ,パラメータを最適化し,リスク管理措置を導入することを検討することができます.
Source
Pine
/*backtest
start: 2023-03-26 00:00:00
end: 2024-03-31 00:00:00
period: 1d
basePeriod: 1h
exchanges: [{"eid":"Futures_Binance","currency":"BTC_USDT"}]
*/

//@version=5
strategy('Trend Following 8&21EMA with strategy tester [ukiuro7]', overlay=true, process_orders_on_close=true, calc_on_every_tick=true, initial_capital = 10000)

//INPUTSStrategy parameters
Related strategies
Comment
All comments (0)
No data
- 1