
개요
월별 트렌드 브레이크 전략은 파인 스크립트를 기반으로 한 TradingView 지표이다. 이 전략은 자율적인 이동 평균, 트렌드 라인 브레이크 및 RSI 지표의 조합을 사용하여 한 달에 한 번만 다중이 입상할 때를 결정한다. RSI 지표가 초과 구매를 표시하면 평형 상태에서 퇴출한다.
전략 원칙
-
변수를 정의 lastEntryMonth 기록의 마지막 입문 달. currentMonth는 현재 달을 얻는다.
-
TRAMA를 이동 평균 변수 length=99에 적응하도록 설정하여 가격을 평형화하고 트렌드 방향을 판단하십시오.
-
length_trend=14을 설정하고, upper의 최고점을 그리는 트렌드 라인을 설정합니다. 가격이 트렌드 라인을 상단으로 통과하면 돌파구로 판단합니다.
-
RSI 지표 파라미터를 계산 rsiLength=14, 과매매를 판단한다.
-
진입 논리: 종전 가격이 TRAMA보다 높고, 종전 가격이 궤도를 돌파할 때, 지난 달에 진입하지 않았다면, 더 많은 진입을 한다.
-
출전 논리: RSI가 70보다 크면 평점
-
트라마 곡선을 그리고 RSI의 초상 구매 선을 그리고 전략을 완성한다.
이 전략은 세 가지 주요 기술 지표를 통합하여 트렌드, 모멘텀, 과매매 상황을 판단하고, 한 달에 한 번만 더 낮은 위험을 더 많이 할 기회를 찾습니다. 또한, 가격의 상승 추세를 뚫고 들어오는 것 만을 제한하고, 평형 영역에서 무효 연산을 피합니다.
우위 분석
-
다양한 지표의 조합, 시장 상태를 종합적으로 판단하고, 의사 결정의 정확성을 향상시킵니다.
-
월간 시간 프레임이 깨졌을 때만 입점하고, 자주 거래하는 것을 피하십시오.
-
이동 평균을 사용하여 트렌드 방향을 판단하여 전환을 빠르게 잡을 수 있습니다.
-
과매매 지표와 함께 시장 고점을 피하고, 위험을 효과적으로 통제한다.
-
간단한, 직관적인 입출장 조건, 쉽게 파악할 수 있다.
-
더 나은 전략 최적화를 위해 필요에 따라 매개 변수를 조정할 수 있습니다.
위험 분석
-
파격 실패로 인한 휘프사우 위험. 출입 후 가격이 다시 추락하여 손실이 발생할 수 있습니다.
-
트렌드 돌파 시점 선택은 좋지 않으며, 상위 근처의 높은 입구를 선택한다.
-
지표 파라미터가 잘못 설정되어 지표가 잘못된 신호를 낸다.
-
브레이크만 Reflect recent market volatility. Consider adaptive stops/position sizing. 최근 시장의 변동성을 반영하기 위한 브레이크만.
-
Monitor risk/reward. Consider only trading pullbacks or adding other confirmation filters.
-
Validate indicators on multiple timeframes. Use higher timeframes to identify trend and lower for entry.
-
Backtest over different market conditions. Optimize parameters to match strategy to market type.
최적화 방향
-
Volume, MA 거래량 지표의 확인을 추가하여 낮은 양의 가짜 돌파구를 피하십시오.
-
RSI가 평평한 지위를 초과할 때, 일부 이익의 손실을 고려하고 나머지는 지위를 유지하십시오.
-
이동 평균 파라미터를 최적화하고, 변화에 적응하고, 트렌드 전환을 더 잘 추적한다.
-
돌파점 전후 구간을 설정하고, 전환점 고위점으로 직접 진입하는 것을 피한다.
-
더 많은 필터링 조건을 추가하여 의사 결정의 정확성을 향상시킵니다.
-
등급 입시, 가격이 새로운 저항선을 돌파하는 것을 계속할 때, 지분을 올릴 수 있다.
요약하다
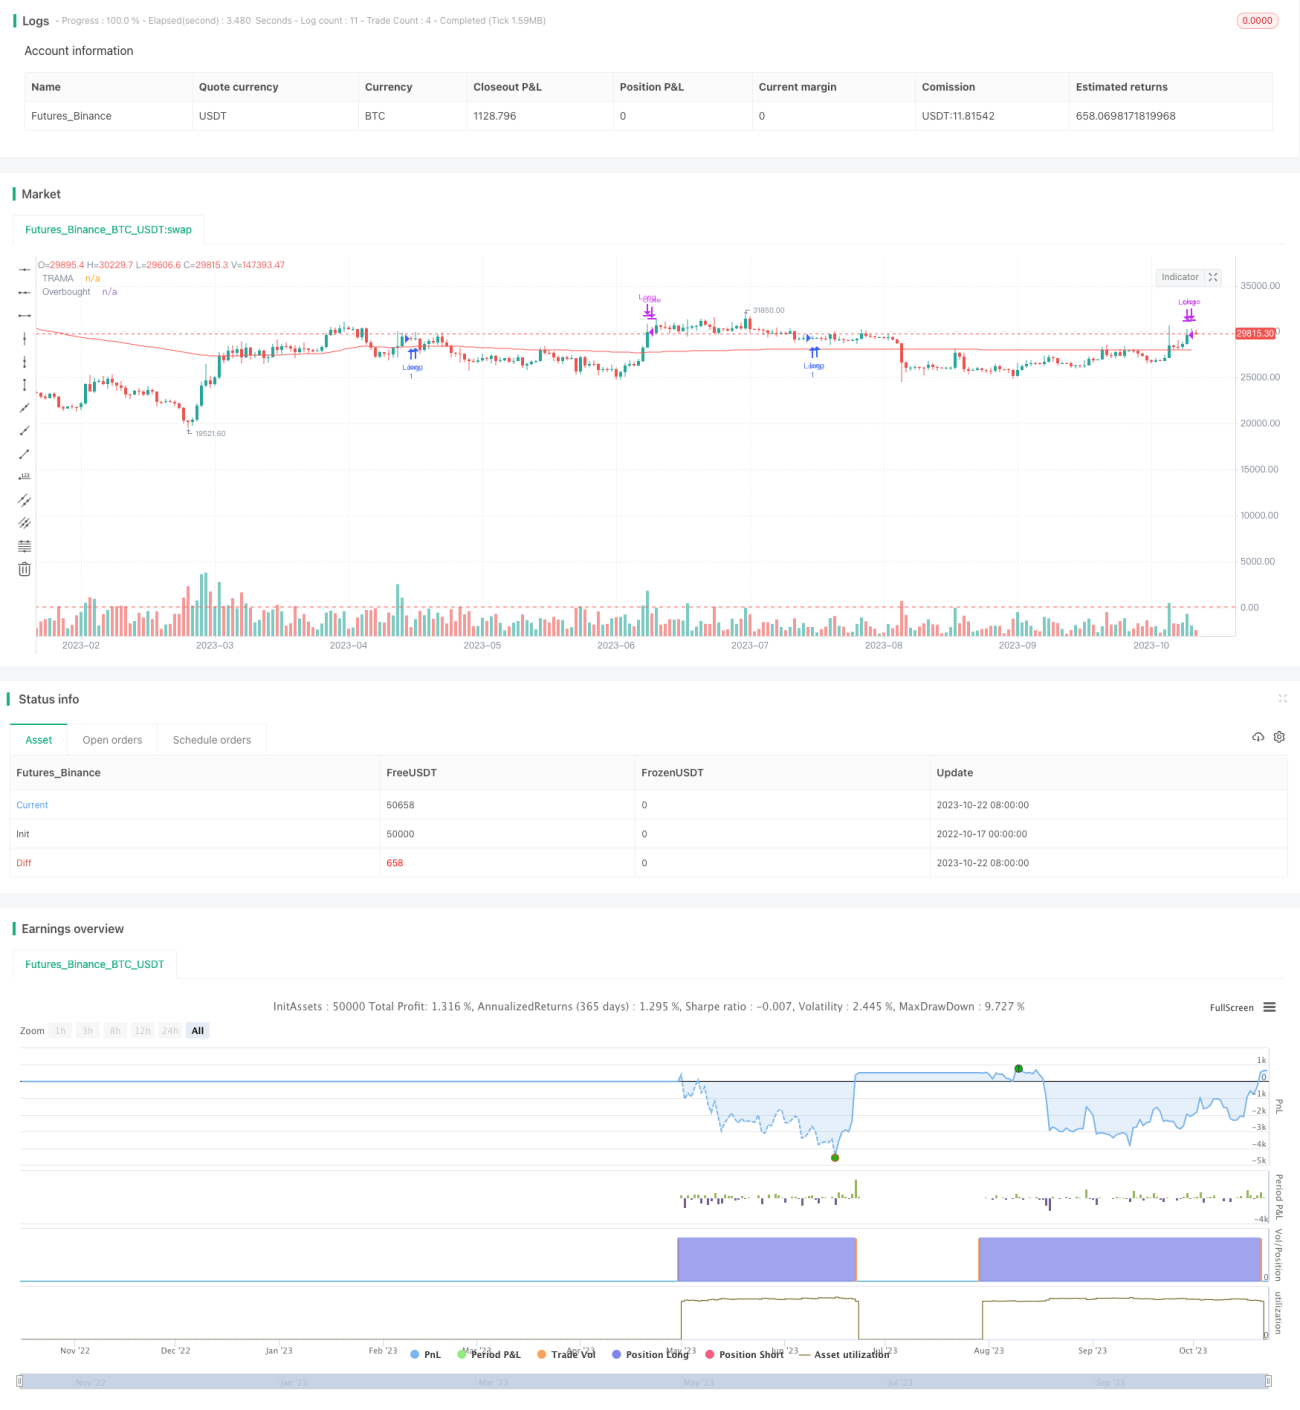
월간 트렌드 브레이킹 전략은 종합적으로 트렌드, 에너지 및 한계 상태와 같은 여러 가지 요소를 고려합니다. 월간 시간 프레임에서 트렌드 방향을 판단하고 더 낮은 시간 프레임의 브레이킹 실행에 참여합니다. 동시에 RSI 지표를 사용하여 거래 위험을 효과적으로 제어합니다. 이 전략은 매월 한 번 더 우수한 기회를 찾는 간단한 논리를 사용합니다. 트렌드 추적을 고려하고 위험 관리에 중점을 둡니다.
/*backtest
start: 2022-10-17 00:00:00
end: 2023-10-23 00:00:00
period: 1d
basePeriod: 1h
exchanges: [{"eid":"Futures_Binance","currency":"BTC_USDT"}]
*/

//@version=5
strategy('Bannos Strategy', shorttitle='Bannos', overlay=true)

//The provided script is an indicator for TradingView written in Pine Script version 5. The indicator is used to determine entry and exit points for a trading strategy. Here's a detailed breakdown of what the script does:- 1