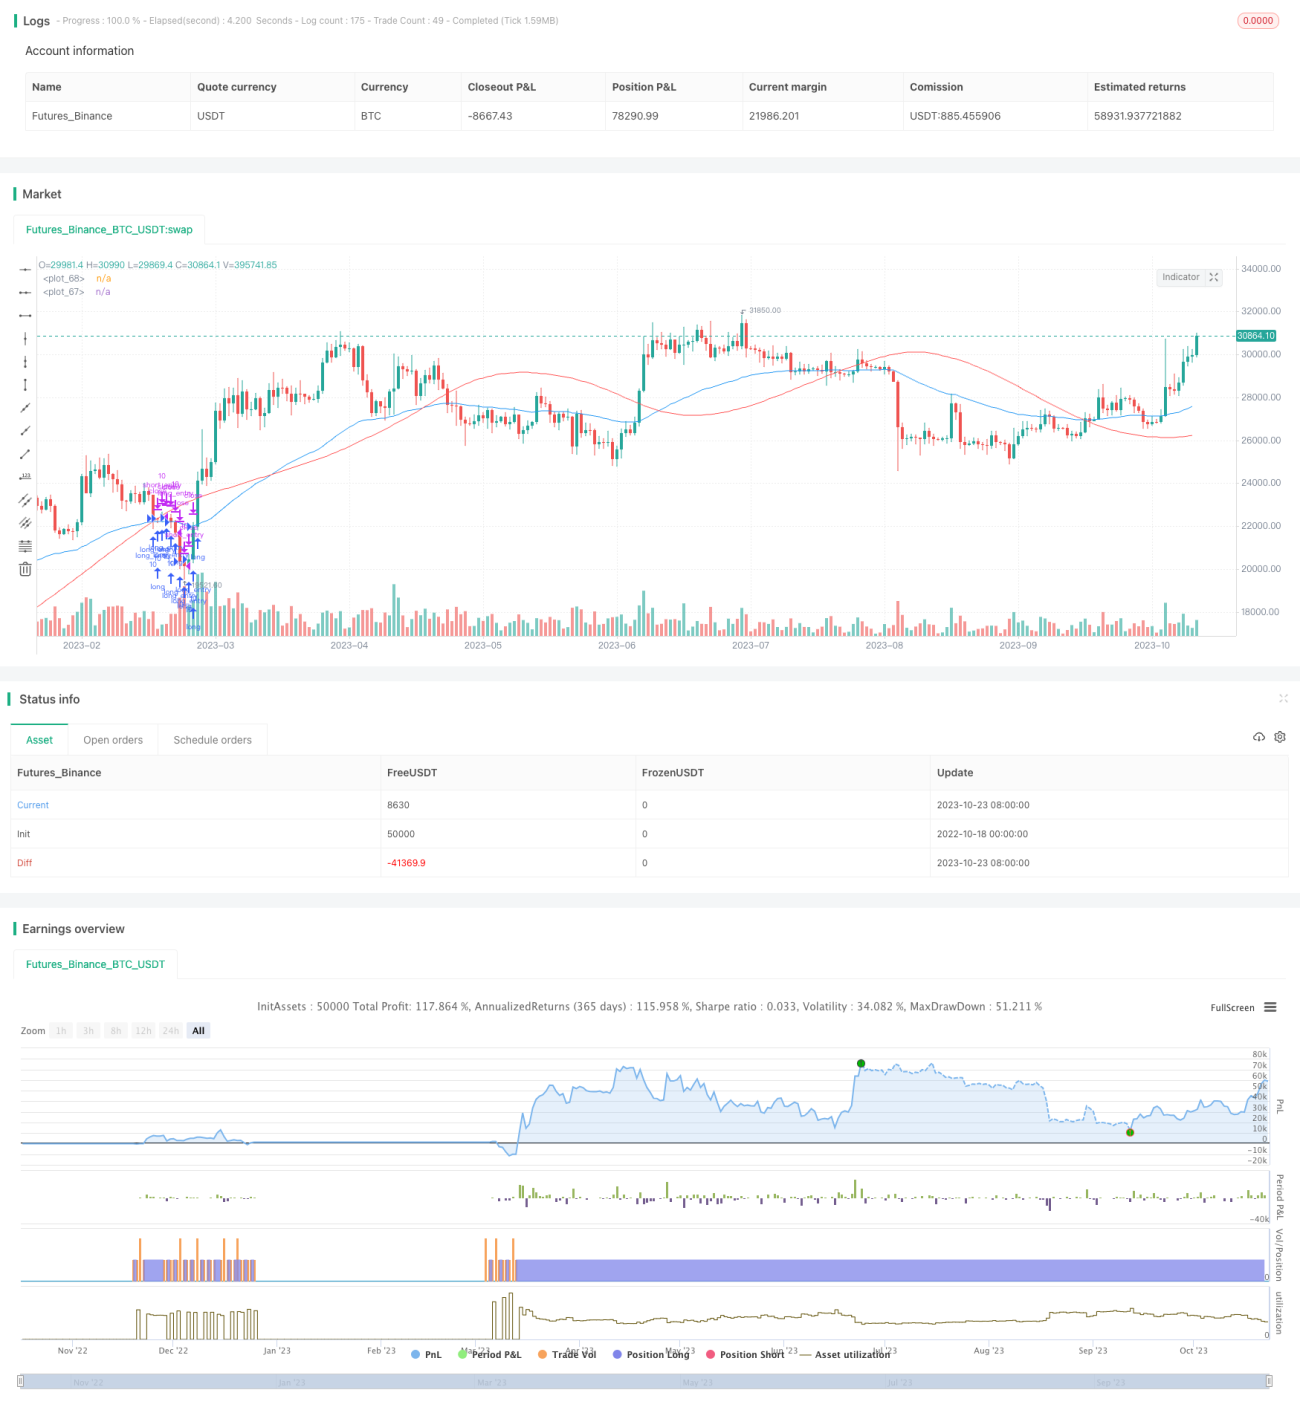
선형 회귀 이동 평균 거래 전략

저자:차오장, 날짜: 2023-10-25 10:58:02
태그:

img

전반적인 설명

선형 회귀 이동 평균 거래 전략은 선형 회귀 라인과 주식 가격의 이동 평균 사이의 교차를 기반으로 구매 및 판매 신호를 생성합니다. 이 전략은 잠재적인 반전을 식별하고 낮은 구매 및 높은 판매를 달성하기 위해 추세를 따라 선형 회귀 분석을 결합합니다.

전략 논리

전략은 먼저 n일 선형 회귀선과 주식 가격의 m일 이동 평균을 계산합니다. 회귀선은 장기 통계 추세를 포착하고 이동 평균은 단기 동력을 반영합니다.

이동 평균이 회귀선을 넘으면 상승 동력을 강화하고 구매 신호를 생성합니다. 이동 평균이 아래를 넘으면 상승을 약화하고 판매 신호를 생성합니다.

구체적으로 전략은 무역 신호를 결정하는 다음 단계를 따르고 있습니다.

  1. 가격의 n 일선 회귀 선을 계산합니다.

  2. lrLine의 m-day 간단한 이동 평균을 계산합니다. lrMA라고 합니다.

  3. m-day 지수적 이동 평균을 계산합니다.

  4. EMA가 lrMA를 넘을 때, 사기 신호를 생성합니다.

  5. EMA가 lrMA 아래로 넘어가면 판매 신호를 생성합니다

  6. 시장이 상승할 때만 구매 신호를 고려하십시오.

  7. 신호를 기반으로 거래를 실행

회귀와 이동 평균 사이의 교차를 사용하여 엔트리를 결정함으로써 전략은 잘못된 브레이크를 효과적으로 필터링하고 낮은 구매와 높은 판매를위한 반전을 식별 할 수 있습니다.

장점

  • 정확한 신호 식별을 위해 경향 및 회귀 분석을 결합합니다.
  • 회귀 선은 계산하고 구현하기 쉽습니다
  • 불리한 거래를 피하기 위해 시장 필터를 사용합니다.
  • 전략을 조정할 수 있는 매개 변수
  • 수익을 위해 낮은 가격에 구매하고 높은 가격에 판매

위험성

  • 변동성 중 빈번한 교차가 잘못된 신호를 생성할 수 있습니다.
  • 부정확한 시장 필터로 인해 잘못된 시간으로 입력됩니다.
  • 매개 변수 조정이 안 되면 전략 성능에 영향을 미칩니다.
  • 높은 거래 빈도는 더 높은 비용으로 이어집니다.

매개 변수는 이동 평균 및 회귀 라인 기간을 증가시키고 거래 빈도를 줄이기 위해 조정되어야합니다. 위험을 제어하기 위해 합리적인 스톱 손실이 구현되어야합니다. 정확성을 향상시키기 위해 시장 필터를 향상시킬 수 있습니다.

개선

이 전략은 몇 가지 측면에서 최적화 될 수 있습니다.

  1. 다양한 유형의 MAs를 테스트함으로써 이동 평균 최적화

  2. 계산 기간을 조정하여 회귀 선 최적화

  3. 다양한 지표를 테스트함으로써 시장 필터 최적화

  4. 엄격한 백테스팅을 통해 매개 변수 최적화

  5. 다른 스톱 로스 논리를 테스트함으로써 스톱 로스 최적화

  6. 비용에 따라 거래 빈도를 조정하여 비용 최적화

이러한 최적화는 전략의 안정성과 수익성을 더욱 향상시킬 수 있습니다.

결론

선형 회귀 MA 전략은 트렌드 분석과 선형 회귀의 장점을 통합하여 효과적인 반전을 식별하고 낮은 판매 높은 것을 구입합니다. 간편한 전략은 중장기 지평에서 주식을 선택하는 데 적합합니다. 매개 변수 조정 및 위험 통제로 전략은 더욱 높은 안정성을 달성 할 수 있습니다. 시장 분석을위한 실행 가능한 기술적 거래 프레임워크를 제공합니다.


/*backtest
start: 2022-10-18 00:00:00
end: 2023-10-24 00:00:00
period: 1d
basePeriod: 1h
exchanges: [{"eid":"Futures_Binance","currency":"BTC_USDT"}]
*/

// This source code is subject to the terms of the Mozilla Public License 2.0 at https://mozilla.org/MPL/2.0/
// © lazy_capitalist

//@version=5
strategy('Linear Regression MA', overlay=true, initial_capital=10000)
datesGroup = "Date Info"
startMonth = input.int(defval = 1,    title = "Start Month",  minval = 1, maxval = 12,  group=datesGroup)
startDay   = input.int(defval = 1,    title = "Start Day",    minval = 1, maxval = 31,  group=datesGroup)
startYear  = input.int(defval = 2022, title = "Start Year",   minval = 1970,            group=datesGroup)

averagesGroup = "Averages"
lrLineInput     = input.int(title="Linear Regression Line",   defval=55, minval = 1, group=averagesGroup)
lrMAInput       = input.int(title="Linear Regression MA",     defval=55, minval = 1, group=averagesGroup)
emaInput        = input.int(title="EMA Length",               defval=55, minval = 1, group=averagesGroup)


tradesGroup = "Execute Trades"
executeLongInput    = input.bool(title="Execute Long Trades",       defval=true)
executeShortInput   = input.bool(title="Execute Short Trades",      defval=true)
executeStopLoss     = input.bool(title="Execute Stop Loss",         defval=true)

fourHrSMAExpr       = ta.sma(close, 200)
fourHrMA            = request.security(symbol=syminfo.tickerid, timeframe="240", expression=fourHrSMAExpr)

bullish             = close > fourHrMA ? true : false


maxProfitInput              = input.float(  title="Max Profit (%)",         defval=10.0,    minval=0.0)   * 0.01
stopLossPercentageInput     = input.float(  title="Stop Loss (%)",          defval=1.75,    minval=0.0)   * 0.01

start       = timestamp(startYear, startMonth, startDay, 00, 00)            // backtest start  window
window()    => time >= start ? true : false                              // create function "within window of time"
showDate    = input(defval = true, title = "Show Date Range")

lrLine = ta.linreg(close, lrLineInput, 0)
lrMA   = ta.sma(lrLine, lrMAInput)
ema     = ta.ema(close, emaInput)

longEntry   = ema   < lrMA
longExit    = lrMA  < ema

shortEntry  = lrMA  < ema
shortExit   = ema   < lrMA


maxProfitLong   = strategy.opentrades.entry_price(0) * (1 + maxProfitInput)
maxProfitShort  = strategy.opentrades.entry_price(0) * (1 - maxProfitInput)

stopLossPriceShort  = strategy.position_avg_price * (1 + stopLossPercentageInput)
stopLossPriceLong   = strategy.position_avg_price * (1 - stopLossPercentageInput)

if(executeLongInput and bullish)
    strategy.entry( id="long_entry", direction=strategy.long,   when=longEntry and window(),    qty=10,  comment="long_entry")
    strategy.close( id="long_entry", when=longExit,     comment="long_exit")
    // strategy.close( id="long_entry", when=maxProfitLong <= close, comment="long_exit_mp")
    
if(executeShortInput and not bullish)
    strategy.entry( id="short_entry", direction=strategy.short,   when=shortEntry and window(),    qty=10,  comment="short_entry")
    strategy.close( id="short_entry", when=shortExit,     comment="short_exit")
    // strategy.close( id="short_entry", when=maxProfitShort <= close, comment="short_exit_mp")

if(strategy.position_size > 0 and executeStopLoss)
    strategy.exit(  id="long_entry",        stop=stopLossPriceLong,             comment="exit_long_SL")
    strategy.exit(  id="short_entry",       stop=stopLossPriceShort,            comment="exit_short_SL")
    
// plot(series=lrLine,     color=color.green)
plot(series=lrMA,       color=color.red)
plot(series=ema,        color=color.blue)


더 많은