
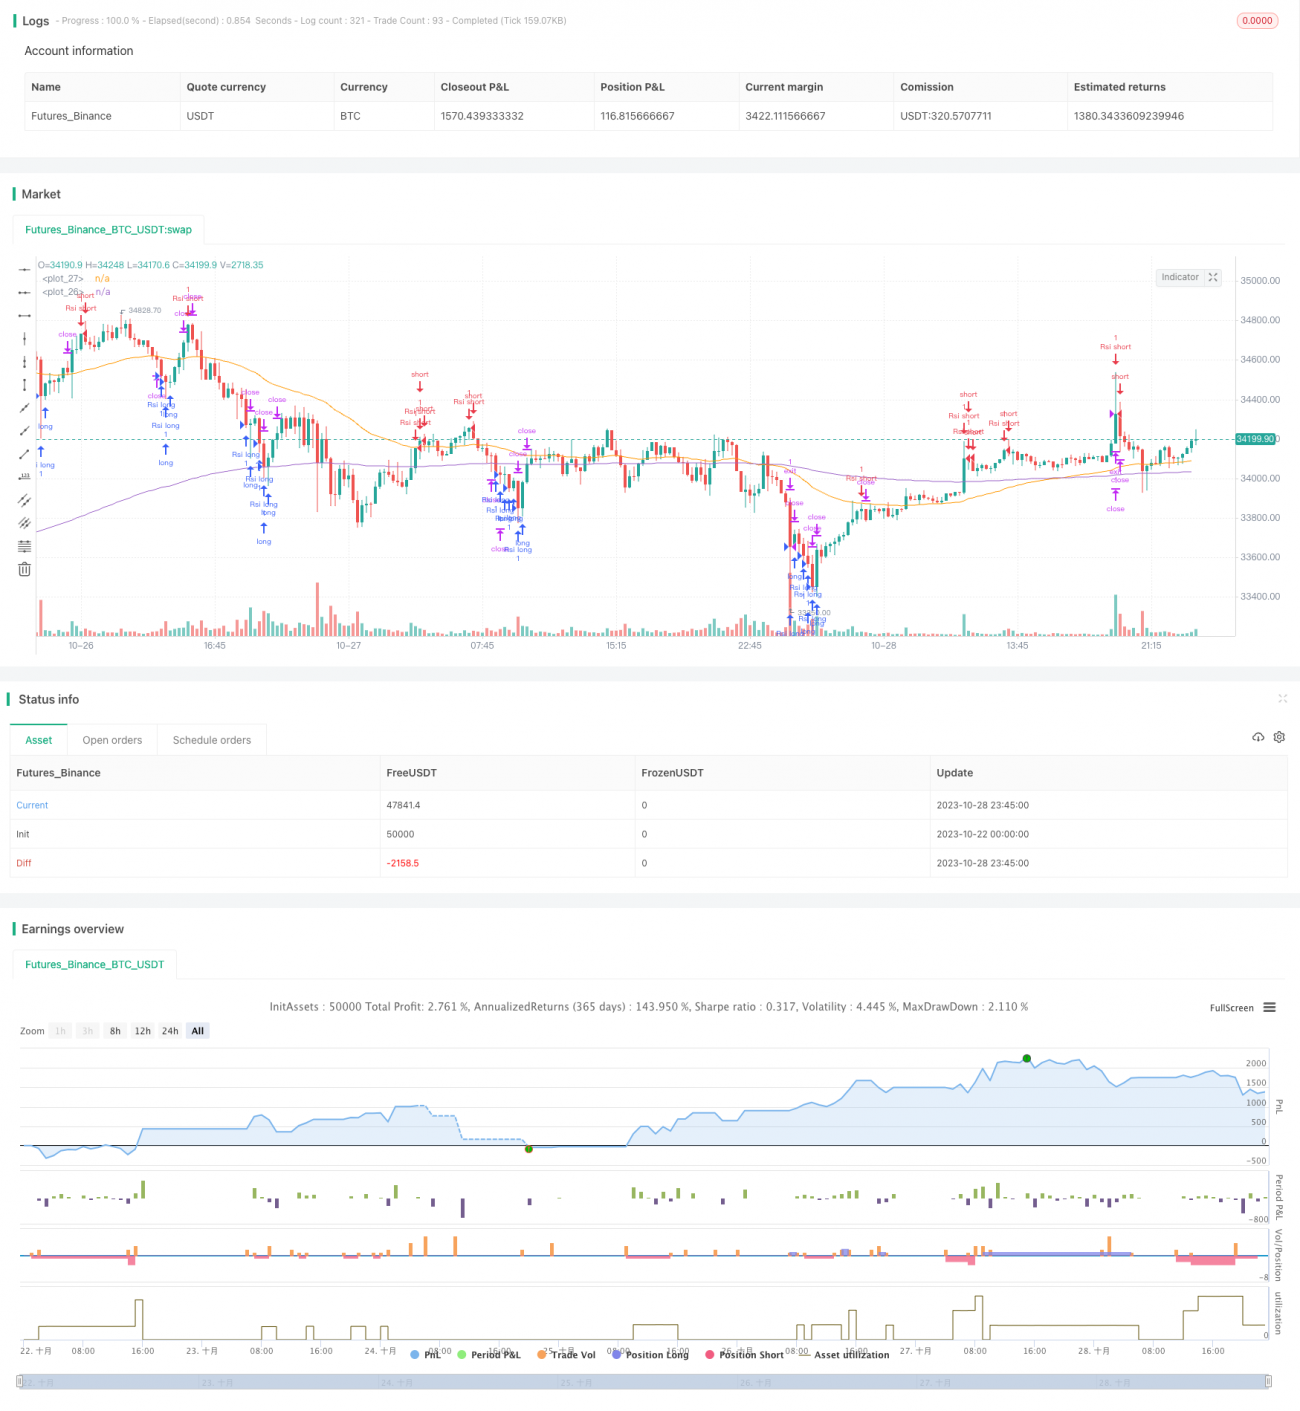
이 전략은 상대적으로 강하고 약한 지수 ((RSI) 지표에 기반한 다중 하위 자동 거래 시스템을 설계했다. RSI가 과매도 과매도 영역에 도달하면 자동으로 다중 하위 신호를 발산하여 자동으로 거래 할 수 있다.
이 전략은 일정 주기 동안의 주식의 상승과 하락을 계산하여 0-100 범위의 RSI 값을 얻습니다. RSI가 30보다 낮으면 과매매 상태이며 70보다 높으면 과매매 상태입니다. 이 규칙에 따라, RSI가 과매 영역에 도달하면 자동으로 더하고, 과매 구매 영역에 도달하면 자동으로 공백합니다.
구체적으로, 전략은 먼저 15주기의 RSI 값을 계산한다. RSI가 20보다 낮아지면, 과매매 상태에 있다고 간주하고, 200일 이동 평균선 위를 돌파할 때, 더 많은 입장을 한다.
또한, 전략은 가격 신호가 발생했을 때, 관련 표시 라인과 태그를 그려서 거래 신호를 더 직관적으로 만듭니다.
위험 제어 조치에는 RSI 파라미터를 최적화하고, 오버 바이 오버 시드 저점을 다양한 품종에 맞게 조정하고, 합리적인 스톱 스팟을 설정하고, 트렌드 지표와 결합하여 역동 거래를 피하는 것이 포함됩니다.
이 전략overall은 RSI 지표를 이용한 오버 바이 오버 세를 판단하는 자동 거래 전략이다. RSI 지표가 오버 바이 오버 세 극단 영역에 도달했을 때 거래 신호를 발산하여 자동으로 거래 작업을 수행할 수 있다. 전략 아이디어는 간단하고 명확하며, 쉽게 구현할 수 있으며, 자동 거래의 기본 전략으로 적합하다. 그러나 RSI 지표는 다소 낙후되어 있기 때문에 신호 정확성을 높이기 위해 다른 지표와 결합하여 최적화하는 것이 좋습니다.
/*backtest
start: 2023-10-22 00:00:00
end: 2023-10-29 00:00:00
period: 15m
basePeriod: 5m
exchanges: [{"eid":"Futures_Binance","currency":"BTC_USDT"}]
*/
//@version=5
strategy("RSI Improved strategy", overlay=true)
higherTF1 = input.timeframe('15' , "Resolution", options = ['5', '15', '1H', 'D', 'W', 'M'])
dailyopen = request.security(syminfo.tickerid, higherTF1, close)
Reward = input(1600)
Risk = input(1600)
length = input( 5 )
overSold = input( 30 )
overBought = input( 70 )
EMA = input(200)
price = close
vrsi = ta.rsi(price, length)
RSIlowest = vrsi[1] > vrsi ? true : false
RSIhighest = vrsi[1] < vrsi ? true : false
//ro = ta.crossunder(vrsi, 20)
//ru = ta.crossover(vrsi, 80)
co = ta.crossunder(vrsi, overSold)
cu = ta.crossunder(vrsi, overBought)
plot(ta.ema(close, EMA))
plot(ta.ema(close, 50), color = color.orange)
UponEMA = close > ta.ema(close, EMA) ? true : false
belowEMA = close < ta.ema(close, EMA) ? true : false
//transfer 'float' to 'int' to 'string'
r = int(vrsi)
value = str.tostring(r)
m = int(strategy.openprofit)
money = str.tostring(m)
if (not na(vrsi))
//when price stand up on 200ema and rsi is at oversold area, open long position
// if (co and UponEMA)
// strategy.order("Rsi long", strategy.long, 1 , comment = "Rsi long")
if(vrsi < 20 and RSIlowest)
// line1 = line.new(x1=bar_index, y1=dailyopen, x2=bar_index+1, y2=dailyopen, xloc=xloc.bar_index, style=line.style_solid,extend=extend.right, color=color.aqua, width = 2)
// line.delete(line1[1]) // remove the previous line when new bar appears
// label1 = label.new(x=bar_index, y=dailyopen,yloc=yloc.belowbar, text = value,textcolor = color.white, color = color.green, style = label.style_label_up)
// label.delete(label1[1])
strategy.order("Rsi long", strategy.long, 1 , comment = "Rsi long")
strategy.exit("exit", "Rsi long", profit = Reward, loss = Risk, comment = "Rsi long exit")
//strategy.close("Rsi short", comment = "Rsi close")
if(vrsi > 80 and RSIhighest)
// line2 = line.new(x1=bar_index, y1=dailyopen, x2=bar_index+1, y2=dailyopen, xloc=xloc.bar_index, style=line.style_solid,extend=extend.right, color = #e65100, width = 2)
// line.delete(line2[1]) // remove the previous line when new bar appears
// label2 = label.new(x=bar_index, y=dailyopen,yloc=yloc.abovebar, text = value, textcolor = color.white, color = color.red)
// label.delete(label2[1])
strategy.order("Rsi short",strategy.short, 1, comment = "Rsi short ")
strategy.exit("exit", "Rsi short", profit = Reward,loss = Risk, comment = "Rsi short exit")
// if(UponEMA)
// strategy.close("Rsi short", comment = "Rsi short close")
//plot(strategy.equity, title="equity", color=color.red, linewidth=2, style=plot.style_cross)
//plotshape(confirmPH, title="Label",offset = 1,text="Bull",style=shape.labeldown,location=location.abovebar,color=color.green,textcolor=color.green)
//when Rsi reaches overbought, draw a Horizontal Ray to close prices, similarly when it comes to oversold.(accomplished)
//detects when there is more lower/higher RSI values, adjust horizontal Ray and label to new posistion.(accomplished)