이동평균파 전략과 결합된 트렌드 편차 지표 K-라인

1
Follow
1778
Followers
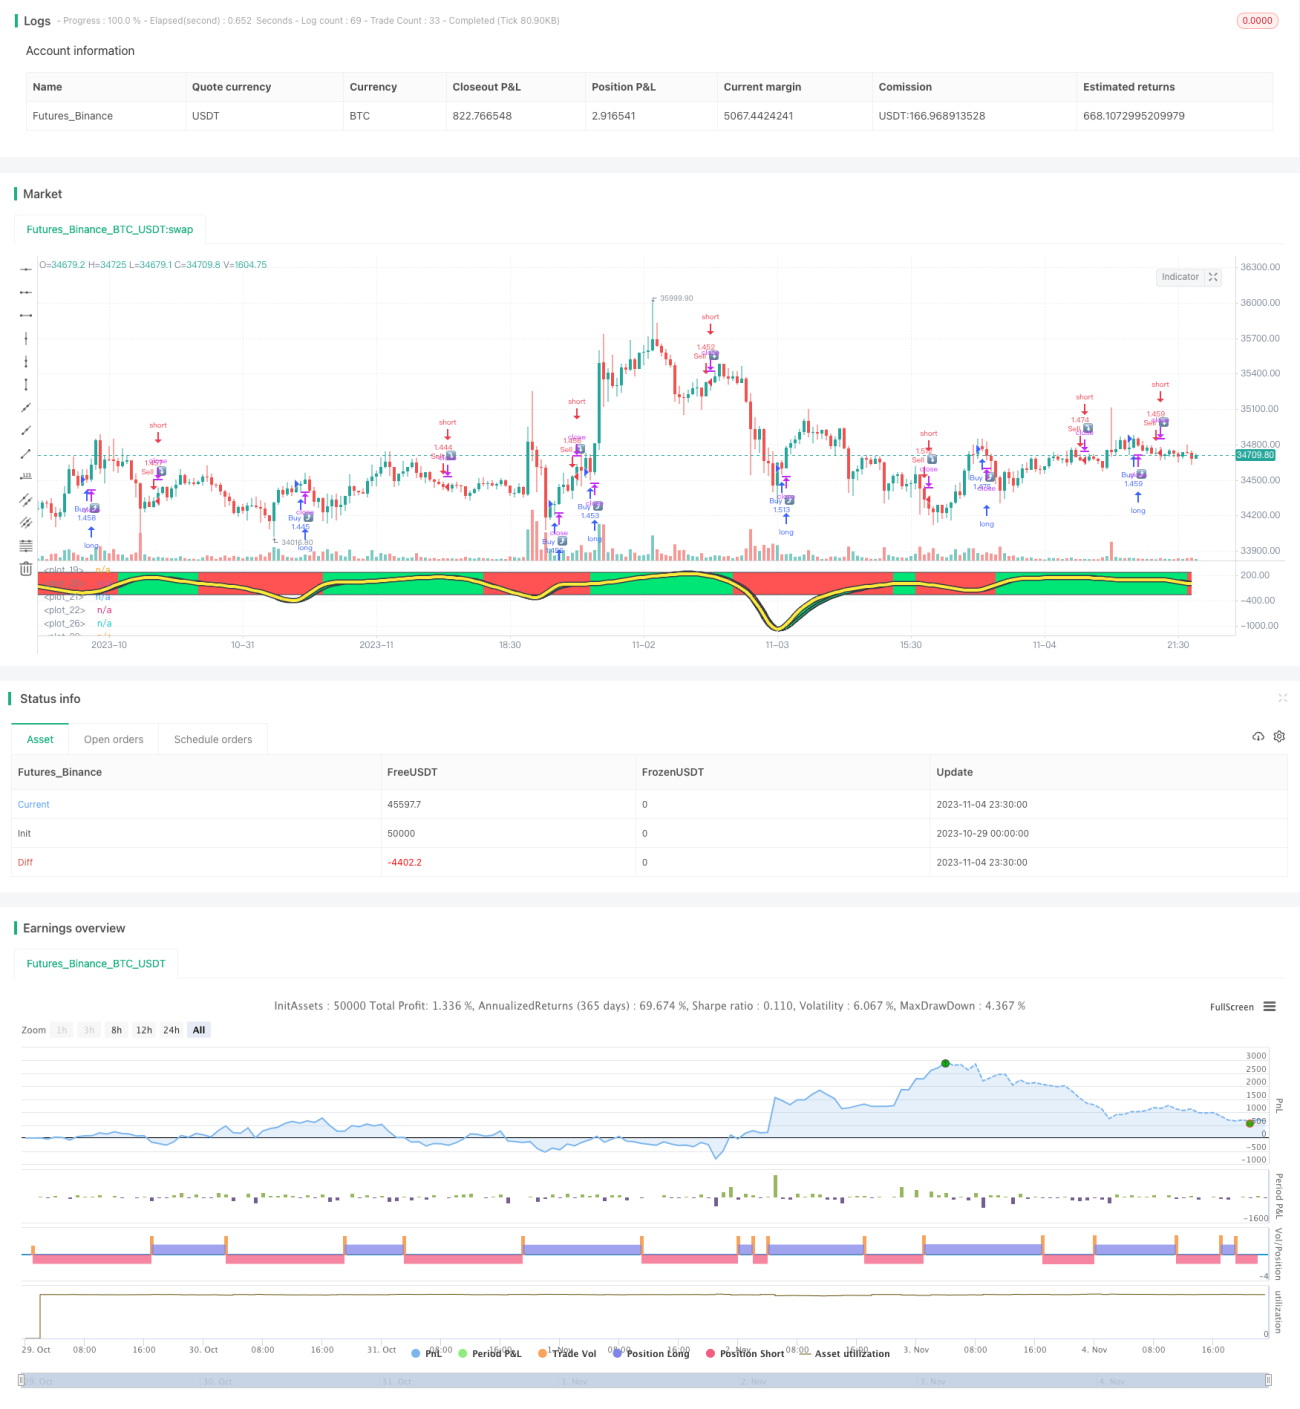
개요
이 전략은 가격의 트렌드를 계산하여 TSI 지표에서 벗어난 다음 TSI를 이동 평균 처리하여 TSI 지표의 이동 평균을 형성합니다. 가격의 K선 방향과 결합하여 현재 주가가 상승 추세 또는 하락 추세에 있다고 판단하여 구매 및 판매 신호를 생성합니다.
원칙
이 전략은 다음과 같은 몇 가지 단계로 구성됩니다.
- 가격의 변화 pct
- pct에 대해 이중 HMA 평준화 작업을 수행하여 double_smoothed_pc를 얻습니다.
- pct의 절대값의 이중 HMA를 계산하여 double_smoothed_abs_pc를 얻는다.
- TSI의 값을 계산합니다:*(double_smoothed_pc / double_smoothed_abs_pc))
- TSI 값을 HMA 이동 평균으로 처리하여 TSI의 이동 평균 tsihmaline을 얻습니다.
- TSI 값과 TSI 이동 평균의 관계를 비교하여, TSI 값이 이동 평균보다 높을 때 상승 추세, TSI 값이 이동 평균보다 낮을 때 감소 추세
- 상승 추세에서, 가격이 상승하는 경우, 구매 신호가 발생
- 하향 추세에서, 가격이 하향을 향하는 경우, 판매 신호가 생성됩니다
위 단계들을 통해, 현재 전체적인 트렌드 방향을 판단할 수 있으며, 가격의 실제 움직임과 결합하여 거래 신호를 생성할 수 있다.
장점
- 이중 HMA 부드러운 처리, 효율적으로 단기 잡음을 필터링, 주요 트렌드를 잠금
- TSI는 이동 평균을 사용하여 전체 추세 방향을 판단합니다.
- 가격 K선 방향과 결합하여 가짜 돌파구를 방지하고 신호의 신뢰성을 높인다.
- 매개 변수는 조정할 수 있으며 시장에 따라 매개 변수를 조정하여 다른 주기에 적응할 수 있습니다.
- 그래프는 직관적입니다. 녹색은 상승 추세이고 빨간색은 하락 추세입니다.
위험
- 지진이 일어나면 여러번의 잘못된 신호가 발생한다.
- 트렌드 전환점에서는 이동 평균이 지연되어 최적의 입구 지점을 놓칠 수 있습니다.
- 시장의 변화에 맞춰 변수를 자주 조정해야 합니다.
- 이 전략은 단 하나의 TSI 지표에만 기반을 두고 있으며, 다른 지표들과 조합하여 최적화할 수 있습니다.
최적화 방향
- 필터를 추가하여 흔들리는 시장에서 잘못된 신호를 방지할 수 있습니다.
- 다른 지표로 판단하여 트렌드 전환점을 확인할 수 있습니다.
- 기계 학습과 같은 방법을 통해 자동으로 최적화 할 수 있는 매개 변수
- 단편적 손실을 제어하기 위한 스톱 손실 전략을 도입할 수 있습니다.
요약하다
이 전략은 트렌드 방향을 판단하는 TSI 지표를 사용하고 가격 K 선과 결합하여 거래 신호를 생성합니다. 트렌드를 효과적으로 포착하여 상승 추세에서 구매하고 하향 추세에서 판매 할 수 있습니다. 그러나 안정성을 높이기 위해 최적화 할 필요가 있습니다.
Source
Pine
/*backtest
start: 2023-10-29 00:00:00
end: 2023-11-05 00:00:00
period: 30m
basePeriod: 15m
exchanges: [{"eid":"Futures_Binance","currency":"BTC_USDT"}]
*/

//@version=4
strategy(title="TSIHULLBOT", shorttitle="TSICCIHULL", default_qty_type=strategy.percent_of_equity, default_qty_value=100)
long = input(title="Long Length", type=input.integer, defval=50)
short = input(title="Short Length", type=input.integer, defval=50)Strategy parameters
Related strategies
Comment
All comments (0)
No data
- 1