
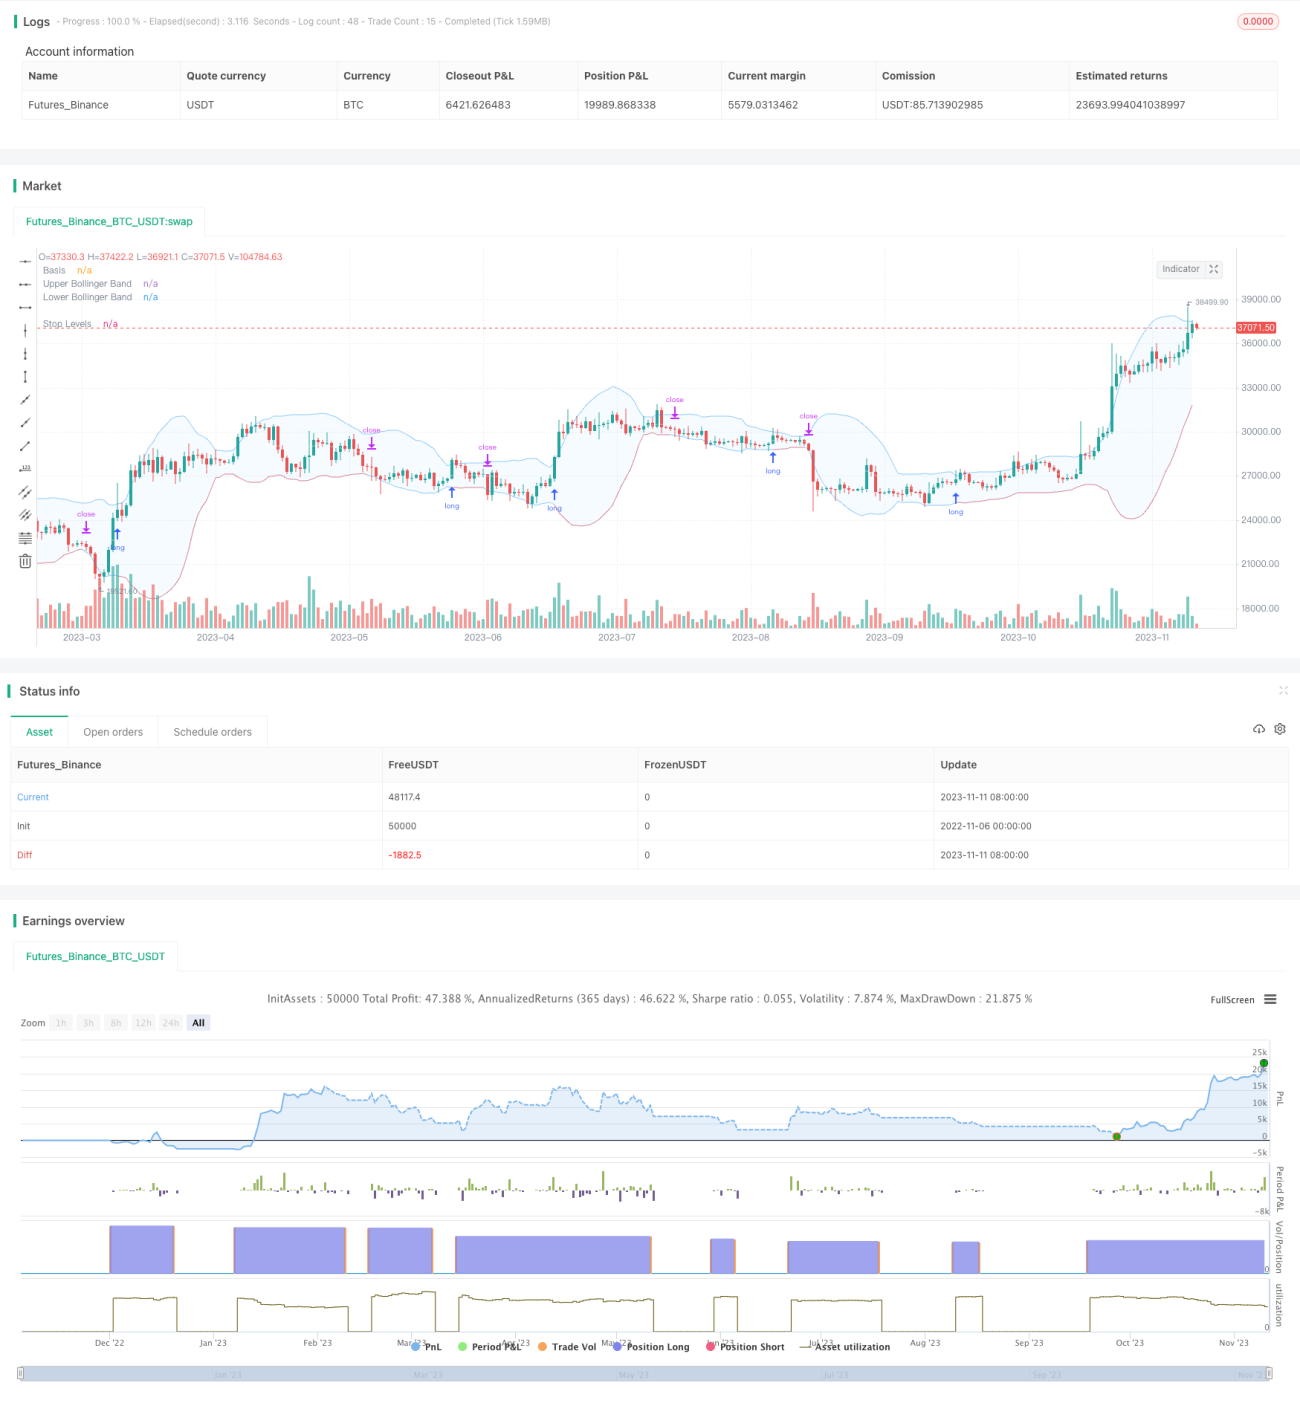
이 전략은 부린띠의 동적 상하를 활용하여 가격이 부린띠의 상하를 돌파할 때 더 많이 하고, 가격이 부린띠의 상하를 넘어갈 때 평지한다. 전통적인 돌파 전략과는 달리, 부린띠의 상하는 역사적인 변동률의 동적 변화에 따라 변화하며, 시장의 과매매 상태를 더 잘 판단할 수 있다.
이 전략은 주로 부린 띠 지표의 가격 판단에 의존한다. 부린 띠는 세 개의 선을 포함한다:
가격 상승이 상반도를 초과할 때, 시장이 과매상태에 있다고 생각하면 더 할 수 있다. 가격 하락이 하반도를 초과할 때, 시장이 과매상태에 있다고 생각하면 평지해야 한다.
이 정책은 브린띠의 파라미터를 사용자 정의할 수 있습니다: 중선 길이는 n이고 표준차의 배수는 k。 기본 중선 길이는 20일이고 표준차의 배수는 2。
주식이 매일 폐장한 후, 당일 폐장 가격의 상승세를 뚫었는지 확인한다. 만약 그렇다면, 다음 날 상장할 때 더 신호를 실행한다. 더 많은 것을 한 후, 가격의 하향세를 뚫었는지 실시간으로 모니터링하고, 만약 돌파하면 평지한다.
이 전략은 또한 평균선 필터를 도입하여 가격이 평균선보다 높을 때만 다중 신호를 생성합니다. 현재 주기 또는 더 높은 주기에서 평균선을 그리는 것을 선택하여 진입 시점을 제어 할 수 있습니다.
손해제도 또한 두 가지 선택이 제공된다: 고정된 비율의 손해제 또는 브린을 추적하는 다운 레일. 후자는 이윤을 운행하는 데 더 많은 공간을 제공합니다.
이 전략은 부린띠의 동적 상하 궤도를 이용하여 과매매를 판단하고, 평선 필터링 신호를 참고하며, 손해보호 자금을 채용한다. 전통적인 고정 궤도 돌파구에 비해, 시장의 변동에 더 잘 적응한다. 변수 최적화 및 위험 통제를 통해 전략의 안정성과 수익률을 더욱 높일 수 있다. 전반적으로 이 전략은 부린띠의 동적 특성을 이용하여 돌파구 전략의 장점을 얻으며, 상장 검증 및 장기 추적 최적화를 가치가 있다.
/*backtest
start: 2022-11-06 00:00:00
end: 2023-11-12 00:00:00
period: 1d
basePeriod: 1h
exchanges: [{"eid":"Futures_Binance","currency":"BTC_USDT"}]
*/
//@version=5
// Revision: 1
// Author: @millerrh
// Strategy:
// Entry: Buy when price breaks out of upper Bollinger Band
// Exit: Trail a stop with the lower Bollinger Band
// Conditions/Variables:
// 1. Can add a filter to only take setups that are above a user-defined moving average on current timeframe and/or longer timeframe (helps avoid trading counter trend)
// 2. Manually configure which dates to back test
// 3. User-Configurable Bollinger Band Settings
// 4. Optionally use a tighter initial stop level. Once Bollinger Band catches up, trail with lower Bollinger Band to give more breathing room.
// strategy('Donchian Breakout', overlay=true, initial_capital=100000, currency='USD', default_qty_type=strategy.percent_of_equity, calc_on_every_tick = true,
// default_qty_value=100, commission_type=strategy.commission.percent, commission_value=0.1)
strategy('Bollinger Breakout', overlay=true, initial_capital=100000, currency='USD', default_qty_type=strategy.percent_of_equity,
default_qty_value=100, commission_type=strategy.commission.percent, commission_value=0.0, calc_on_order_fills=true)
// === BACKTEST RANGE ===
Start = input(defval = timestamp("01 Jan 2019 06:00 +0000"), title = "Backtest Start Date", group = "backtest window")
Finish = input(defval = timestamp("01 Jan 2100 00:00 +0000"), title = "Backtest End Date", group = "backtest window")
// == INPUTS ==
// Bollinger Band Inputs
bbLength = input.int(20, minval=1, group = "Bollinger Band Settings", title="Bollinger Band Length",
tooltip = "Bollinger Band moving average length.")
bbMultTop = input.float(2.0, minval=0.001, maxval=50, title="Standard Deviation (Top)")
bbMultBot = input.float(2.0, minval=0.001, maxval=50, title="Standard Deviation (Bottom)")
useTightStop = input.bool(title='Use Fixed Percentage for Initial Stop?', defval=false, group = "order entry",
tooltip = "'Keep your losers small and let winners run' is the saying. This will allow you to use a tight initial stop
until the lower Bollinger Band catches up.")
percStop = input.int(title="Stop", defval=8, group = "order entry", inline = "perc")
trigInput = input.string(title='Execute Trades On...', defval='Wick', options=['Wick', 'Close'], group = "order entry",
tooltip = "Useful for comparing standing stop orders at the Bollinger Band boundary (executing on the wick) vs. waiting for candle closes prior to taking action")
// Moving Average Filtering Inputs
useMaFilter = input.bool(title='Use Moving Average for Filtering (Current Timeframe)?', defval=false, group = "moving average filtering",
tooltip = "Signals will be ignored when price is under this moving average. The intent is to keep you out of bear periods and only buying when
price is showing strength.")
maType = input.string(defval='SMA', options=['EMA', 'SMA'], title='MA Type For Filtering', group = "moving average filtering")
maLength = input.int(defval=50, title="Moving Average: Length", minval=1, group = "moving average filtering", inline = "1ma")
ma1Color = input.color(color.new(color.green, 50), title = " Color", group = "moving average filtering", inline = "1ma")
useMaFilter2 = input.bool(title='Use Moving Average for Filtering (High Timeframe)?', defval=false, group = "moving average filtering")
tfSet = input.timeframe(defval="D", title="Timeframe of Moving Average", group = "moving average filtering",
tooltip = "Allows you to set a different time frame for a moving average filter. Trades will be ignored when price is under this moving average.
The idea is to keep your eye on the larger moves in the market and stay on the right side of the longer term trends and help you be pickier about
the stocks you trade.")
ma2Type = input.string(defval='SMA', options=['EMA', 'SMA'], title='MA Type For Filtering', group = "moving average filtering")
ma2Length = input.int(defval=50, title="Moving Average: Length", minval=1, group = "moving average filtering", inline = "2ma")
ma2Color = input.color(color.new(color.white, 50), title = " Color", group = "moving average filtering", inline = "2ma")
// === THE BOLLINGER BAND ===
// Logic
bbBasis = ta.sma(close, bbLength)
bbUpper = bbBasis + bbMultTop * ta.stdev(close, bbLength)
bbLower = bbBasis - bbMultBot * ta.stdev(close, bbLength)
// Plotting
plot(bbBasis, "Basis", color=color.new(color.white, 50))
p1 = plot(bbUpper, color=color.new(color.blue, 50), linewidth=1, title='Upper Bollinger Band')
p2 = plot(bbLower, color=color.new(color.blue, 50), linewidth=1, title='Lower Bollinger Band')
fill(p1, p2, title = "Background", color=color.rgb(33, 150, 243, 95))
// == FILTERING LOGIC ==
// Declare function to be able to swap out EMA/SMA
ma(maType, src, length) =>
maType == 'EMA' ? ta.ema(src, length) : ta.sma(src, length) //Ternary Operator (if maType equals EMA, then do ema calc, else do sma calc)
maFilter = ma(maType, close, maLength)
maFilter2 = request.security(syminfo.tickerid, tfSet, ma(ma2Type, close, ma2Length))
// Plotting
plot(useMaFilter ? maFilter : na, title='Trend Filter MA - CTF', color=ma1Color, linewidth=2, style=plot.style_line)
plot(useMaFilter2 ? maFilter2 : na, title='Trend Filter MA - HTF', color=ma2Color, linewidth=2, style=plot.style_line)
// == ENTRY AND EXIT CRITERIA ==
// Trigger stop based on candle close or High/Low (i.e. Wick)
trigResistance = trigInput == 'Close' ? close : trigInput == 'Wick' ? high : na
trigSupport = trigInput == 'Close' ? close : trigInput == 'Wick' ? low : na
buySignal = trigResistance >= bbUpper
buyConditions = (useMaFilter ? bbUpper > maFilter : true) and
(useMaFilter2 ? bbUpper > maFilter2 : true)
// == STOP AND PRICE LEVELS ==
// Configure initial stop level
inPosition = strategy.position_size > 0
stopLevel = strategy.position_avg_price - (strategy.position_avg_price * percStop/100)
posStop = stopLevel > bbLower ? stopLevel : bbLower
// Check if using stop vs. not
stop = useTightStop ? posStop : bbLower
plot(inPosition ? stop : na, style=plot.style_linebr, color=color.new(color.red, 40), linewidth = 1, title = "Stop Levels", trackprice=false)
sellSignal = trigSupport <= stop
// == STRATEGY ENTRIES & EXITS ==
// This string of code enters and exits at the candle close
if trigInput == 'Close'
strategy.entry('Long', strategy.long, when=buyConditions and buySignal)
strategy.close('Long', when=sellSignal)
// This string of code enters and exits at the wick (i.e. with pre-set stops)
if trigInput == 'Wick'
strategy.entry('Long', strategy.long, stop=bbUpper, when=buyConditions)
strategy.exit('Exit Long', from_entry='Long', stop=stop)
strategy.cancel('Long',when= not(buyConditions)) // Resets stop level once buyConditions aren't true anymore