개요
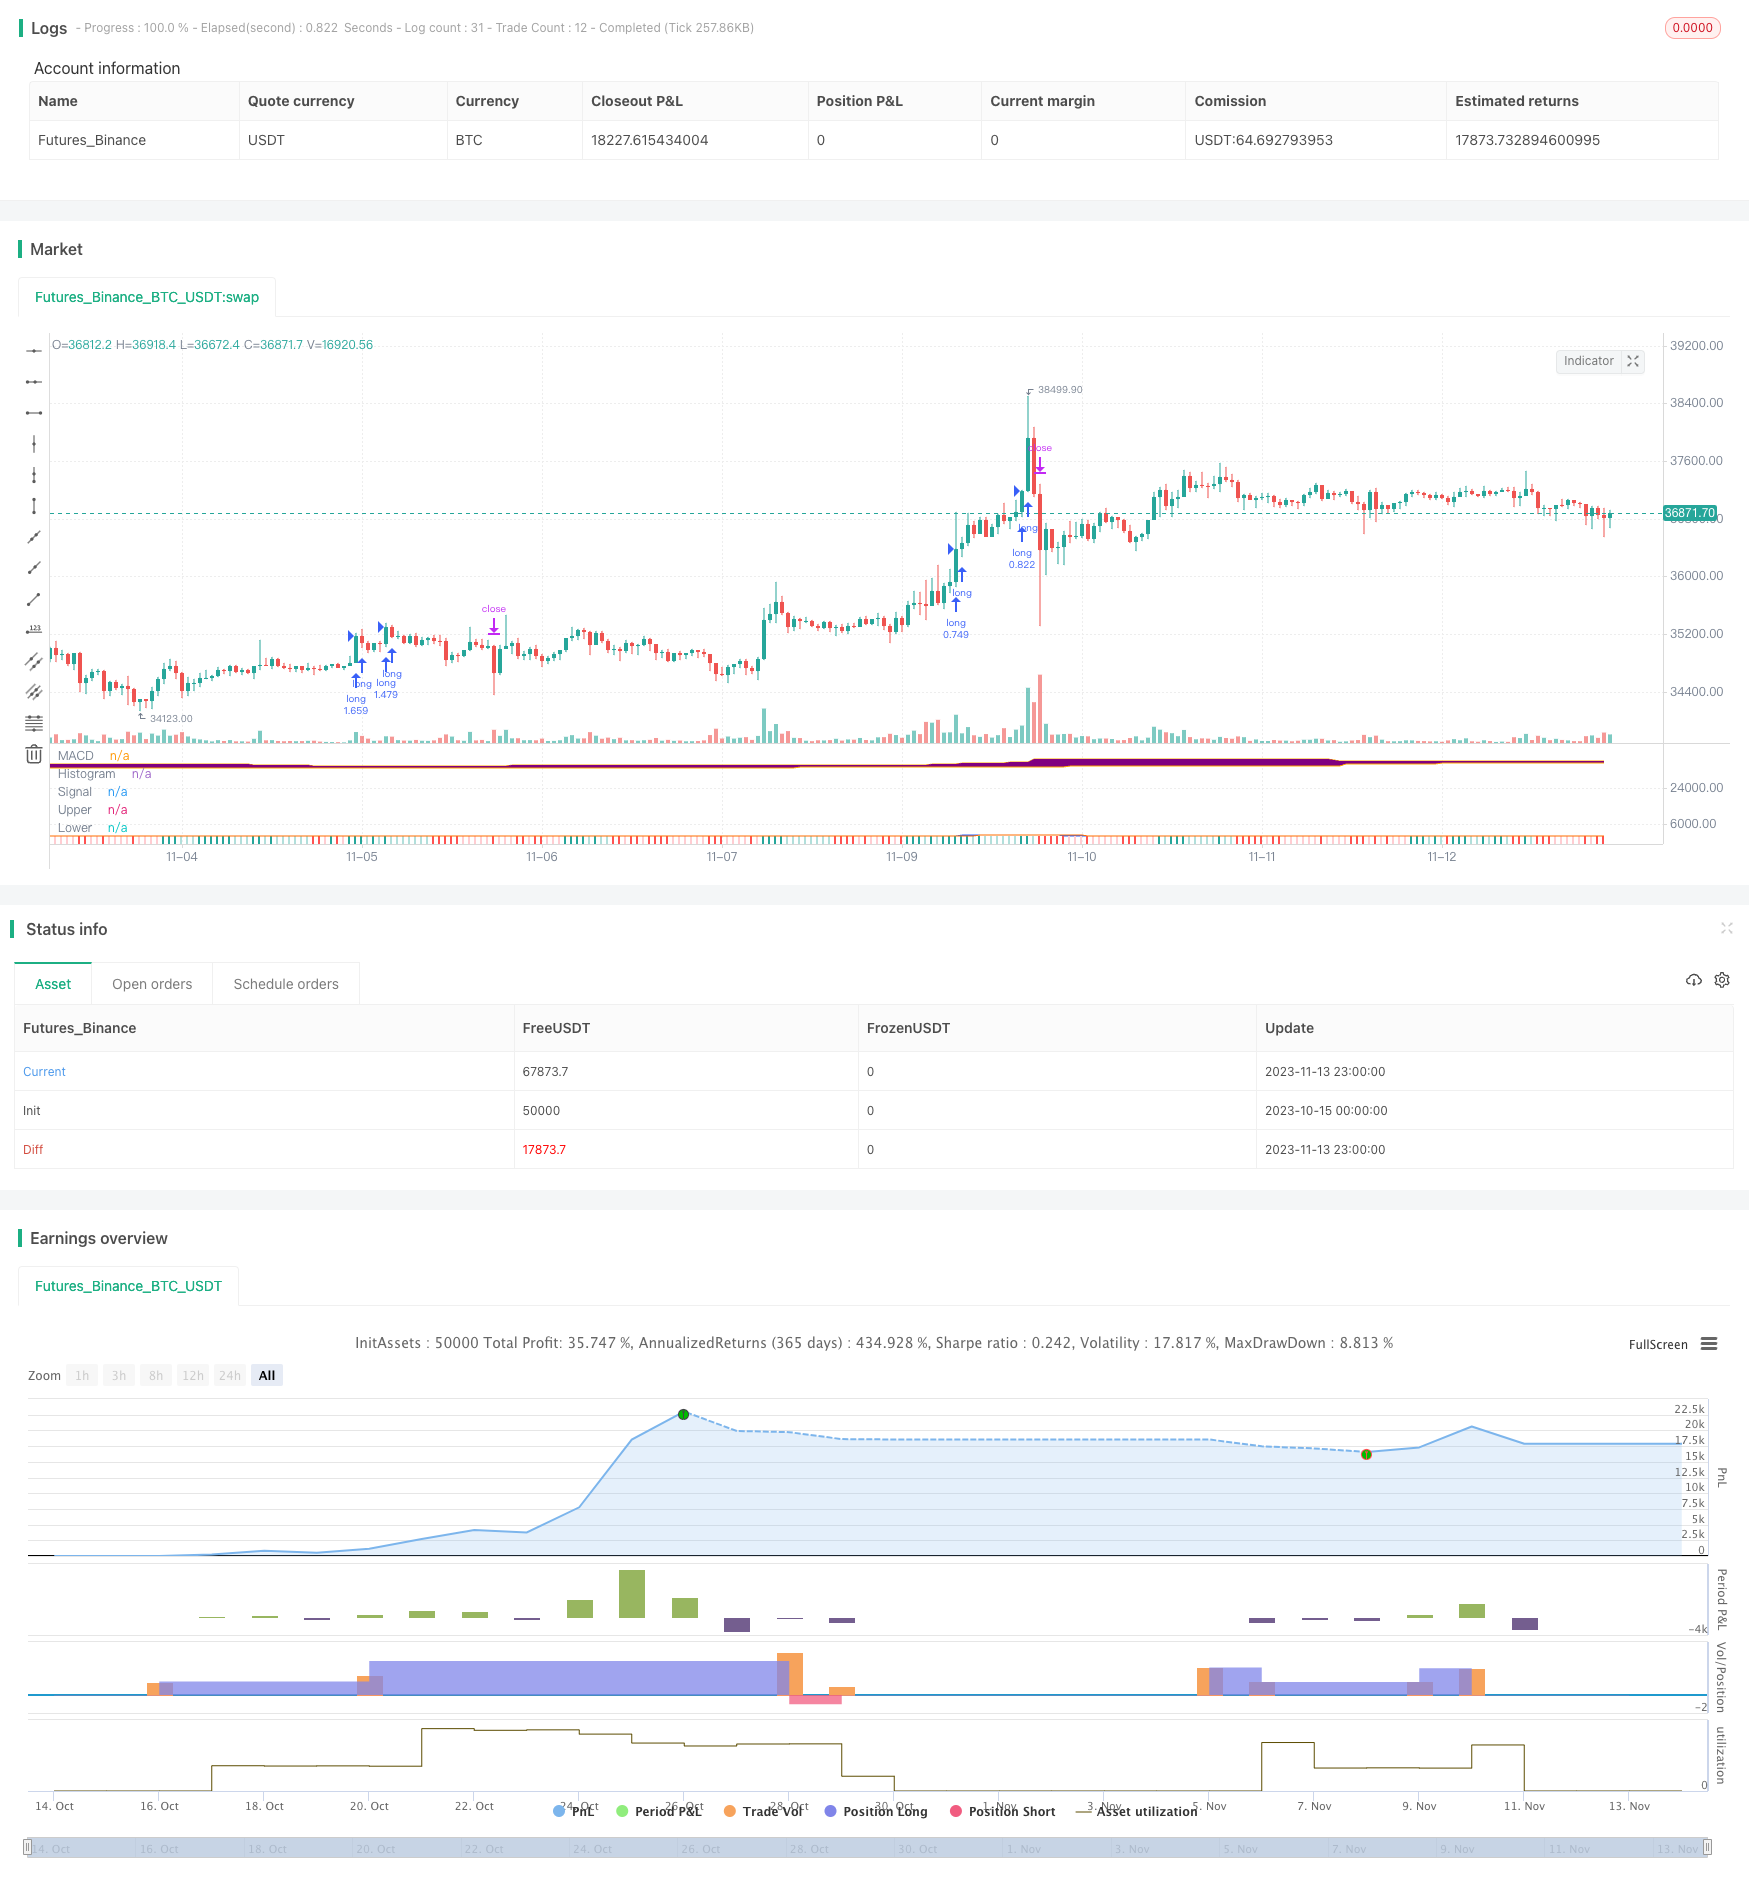
이 전략은 확산 채널 지표와 MACD 지표가 결합되어 트렌드를 판단하는 전형적인 트렌드 추적 전략에 속한다. 가격이 상승 궤도를 돌파하고 MACD 지표가 황금 포크를 나타낼 때 더 많은 것을하고, 가격이 하락 궤도를 돌파하고 MACD 지표가 사다리를 나타낼 때 공백을 만들고, ATR 지표를 사용하여 중지 지점을 계산한다.
전략 원칙
MACD 지표를 계산합니다. 빠른 선, 느린 선, 히스토그램을 포함합니다.
상하 확산 통로를 계산한다. 상하로는 N일간의 최고 가격, 하하로는 N일간의 최저 가격이다.
가격 상승이 일어나면 MACD의 빠른 선이 느린 선을 넘어서면 더 많은 것을하십시오.
가격이 하락하고 MACD 패스트 라인이 느린 라인을 아래로 돌파하면 공백을 다.
ATR 지표를 사용하여 이 전략의 스톱 로드를 계산합니다. 이 스톱 로드는 ATR의 값과 가격 사이의 거리를 한 계수로 곱합니다.
가격 반전 신호가 있을 때, 현재 포지션을 평행한다.
우위 분석
이 전략은 트렌드를 판단하는 지표와 채널 지표를 결합하여 트렌드를 효과적으로 추적할 수 있다. MACD 지표는 가격 트렌드 및 강도를 판단하고, 확산 채널 지표는 방향을 판단한다. ATR 중지 손실은 단위 손실을 제한할 수 있다.
장점은 다음과 같습니다.
정책의 매개 변수는 간단하고 쉽게 구현할 수 있습니다.
이 경우, 거래소에서 거래할 수 있는 상품을 선택하면, 거래소에서 거래할 수 있는 상품을 선택하면, 거래소에서 거래할 수 있습니다.
ATR 무력화는 위험을 통제할 수 있습니다.
하지만, 이 모든 것은 통제할 수 있습니다.
위험 분석
이 전략에는 몇 가지 위험도 있습니다.
확산 통로 파라미터를 잘못 설정하면 가짜 신호가 발생할 수 있다.
MACD 파라미터를 잘못 설정하면 Viticulture Administration System의 경고 신호가 지연될 수 있다.
너무 큰 Stop Loss 설정으로 손실이 커질 수 있습니다.
이 사건은 급격한 반발로 인해 손실이 발생할 수 있습니다.
이 전략은 과도한 거래로 이어질 수 있습니다.
대응방법:
최적화 변수, 신중한 주식 선택.
엄격한 상쇄, 상쇄 추적
포지션 관리를 적절하게 조정하십시오.
최적화 방향
이 전략은 다음과 같은 측면에서 최적화될 수 있습니다.
MACD 파라미터를 최적화하여 지표의 감수성을 높인다.
가격에 가까운 Stop Loss을 위해 Stop Loss 알고리즘을 최적화한다.
포지션 관리 메커니즘을 추가하고, 트렌드에 따라 포지션을 조정한다.
가짜 신호를 방지하기 위해 필터링 조건을 추가합니다.
거래 품종에 대한 선택 기준을 늘립니다.
거래 기간에 대한 판단을 높여주세요.
요약하다
이 전략은 전체적으로 전형적인 트렌드 추적 전략이다. 이 전략은 확산 채널 지표가 트렌드 방향을 판단하고 MACD 지표가 트렌드 강도를 판단하는 것을 결합한다. 순차적으로, 효과적으로 위험을 제어할 수 있다. 최적화된 매개 변수 설정, 손해 중지 방식, 포지션 관리 등의 측면에서 전략의 안정성과 수익률을 더욱 강화할 수 있다. 이 전략은 트렌드 판단에 대한 요구가 높은 투자자의 사용에 적합하다.
/*backtest
start: 2023-10-15 00:00:00
end: 2023-11-14 00:00:00
period: 1h
basePeriod: 15m
exchanges: [{"eid":"Futures_Binance","currency":"BTC_USDT"}]
*/

// This source code is subject to the terms of the Mozilla Public License 2.0 at https://mozilla.org/MPL/2.0/
// © Robrecht99

//@version=5
strategy("Trend Following with Donchian Channels and MACD", overlay=false, margin_long=100, margin_short=100, pyramiding=3)

// MACD //
fast_length = input(title="Fast Length", defval=12)
slow_length = input(title="Slow Length", defval=26)
src = input(title="Source", defval=close)
signal_length = input.int(title="Signal Smoothing",  minval = 1, maxval = 50, defval = 9)
sma_source = input.string(title="Oscillator MA Type",  defval="EMA", options=["SMA", "EMA"])
sma_signal = input.string(title="Signal Line MA Type", defval="EMA", options=["SMA", "EMA"])

col_macd = input(#2962FF, "MACD Line  ", group="Color Settings", inline="MACD")
col_signal = input(#FF6D00, "Signal Line  ", group="Color Settings", inline="Signal")
col_grow_above = input(#26A69A, "Above   Grow", group="Histogram", inline="Above")
col_fall_above = input(#B2DFDB, "Fall", group="Histogram", inline="Above")
col_grow_below = input(#FFCDD2, "Below Grow", group="Histogram", inline="Below")
col_fall_below = input(#FF5252, "Fall", group="Histogram", inline="Below")

fast_ma = sma_source == "SMA" ? ta.sma(src, fast_length) : ta.ema(src, fast_length)
slow_ma = sma_source == "SMA" ? ta.sma(src, slow_length) : ta.ema(src, slow_length)
macd = fast_ma - slow_ma
signal = sma_signal == "SMA" ? ta.sma(macd, signal_length) : ta.ema(macd, signal_length)
hist = macd - signal
plot(hist, title="Histogram", style=plot.style_columns, color=(hist>=0 ? (hist[1] < hist ? col_grow_above : col_fall_above) : (hist[1] < hist ? col_grow_below : col_fall_below)))
plot(macd, title="MACD", color=col_macd)
plot(signal, title="Signal", color=col_signal)

// Donchian Channels //

Length1 = input.int(title="Length Upper Channel", defval=50, minval=1, group="Donchian Channels Inputs")
Length2 = input.int(title="Length Lower Channel", defval=50, minval=1, group="Donchian Channels Inputs")
h1 = ta.highest(high[1], Length1)
l1 = ta.lowest(low[1], Length2)
fillColor = input.color(color.new(color.purple, 95), title = "Fill Color", group = "Donchian Channels Inputs")
upperColor = input.color(color.new(color.orange, 0), title = " Color Upper Channel", group = "Donchian Channels Inputs", inline = "upper")
lowerColor = input.color(color.new(color.orange, 0), title = " Color Lower Channel", group = "Donchian Channels Inputs", inline = "lower")
u = plot(h1, "Upper", color=upperColor)
l = plot(l1, "Lower", color=upperColor)
fill(u, l, color=fillColor)

//ATR and Position Size //
strategy.initial_capital = 50000
length = input.int(title="ATR Period", defval=14, minval=1, group="ATR Inputs")
risk = input(title="Risk Per Trade", defval=0.01, group="ATR Inputs")
multiplier = input(title="ATR Multiplier", defval=2, group="ATR Inputs")
atr = ta.atr(length)
amount = (risk * strategy.initial_capital / (multiplier * atr))

// Buy and Sell Conditions //

entrycondition1 = ta.crossover(macd, signal)
entrycondition2 = macd > signal
entrycondition3 = macd and signal > hist
sellcondition1 = ta.crossover(signal, macd)
sellcondition2 = signal > macd
sellcondition3 = macd and signal < hist

// Buy and Sell Signals //

if (close > h1 and entrycondition2 and entrycondition3)
    strategy.entry("long", strategy.long, qty=amount)
    stoploss = close - atr * 4
    strategy.exit("exit sl", stop=stoploss, trail_offset=stoploss)
if (sellcondition1 and sellcondition2 and sellcondition3)
    strategy.close(id="long")

if (close < l1 and sellcondition2 and sellcondition3)
    strategy.entry("short", strategy.short, qty=amount)
    stoploss = close + atr * 4
    strategy.exit("exit sl", stop=stoploss, trail_offset=stoploss)
if (entrycondition1 and entrycondition2 and entrycondition3)
    strategy.close(id="short")