이중 EMA 이동평균과 ATR 지표를 활용한 추세 추종 전략

개요
이 전략은 두 개의 EMA 평행선을 사용하여 금 포크를 더하고, 죽은 포크를 더하고의 고전적인 추세를 따라가는 전략이며, ATR 지표와 ADX 지표를 사용하여 추가적인 필터링을 통해 강한 추세에서 추적하고, 흔들릴 때 위험을 제어한다.
전략 원칙
이 전략은 다음과 같은 것을 기반으로 합니다.
-
더 짧은 8주기 EMA 평균선과 더 긴 20주기 EMA 평균선을 사용하여 금叉와 사각지대 신호를 형성한다. EMA 평균선 자체는 추세를 따르는 성질을 가지고 있다.
-
ATR 지표는 최근 변동의 폭을 나타냅니다. ATR 지표의 정형화를 통해 EMA 평행선 교차의 필터링 조건을 동적으로 조정할 수 있으며, 강력한 추세를 추적 할 때 요구 사항을 낮추고, 충격적인 상황에서 필터링 요구 사항을 높여 위험을 제어 할 수 있습니다.
-
ADX 지표는 트렌드 강도를 판단한다. ADX 값이 30 이상일 때, 강한 트렌드가 발생했다고 간주하고, 이때 적시에 손실 방어를 중지한다.
-
상하 유행을 고려하여 더 많은 공백을 할 때. 황소 시장에서 금 포크가 더 많이, 곰 시장에서 사다리 공백을 한다.
-
거래량 필터링, 거래량이 커지면 입점한다.
-
USD 지수는 단순히 달러의 강점을 판단하고, 달러의 강점에는 상쇄와 상쇄의 폭이 넓어집니다.
-
슈퍼 트렌드 지표와 결합하여 전반적인 시장 움직임을 판단하고, 더 많은 공백을 할 때를 판단하는 데 도움을줍니다.
이 전략은 트렌드 지표와 쇼크 지표를 완벽하게 결합하여 동적으로 파라미터를 조정하고 트렌드를 추적하면서 위험을 제어 할 수 있습니다.
전략적 이점
-
이중 EMA 평선 시스템을 사용하여 트렌드를 판단합니다. EMA는 부드러우며, 가짜 돌파구를 효과적으로 필터링 할 수 있습니다.
-
ATR 지표는 동적으로 EMA 일률적 크로스 필터링 조건을 조정하여 전략이 다양한 시장 환경에 유연하게 적응할 수 있도록합니다.
-
ADX 지수와 거래량은 보조 판단 지표로, 충격적인 상황에서는 피하지 않는다.
-
달러 지수와 슈퍼 트렌드 지수를 고려하여 큰 트렌드를 판단하여 의사 결정의 정확성을 높여주세요.
-
위험 관리 매개 변수는 달러가 강할 때 자동으로 조정되며, 달러가 강할 때 중지 손실과 중지 폭이 커집니다.
-
간단한 직관적 인 금叉死叉 거래 신호와 손해 중지 전략으로 쉽게 구현 및 재검토 할 수 있습니다.
전략적 위험
-
이중 EMA 평선 시스템은 트렌드 중점 판단이 지연되어 있는 것을 제거한다.
-
ATR 파라미터를 잘못 선택하면 너무 급진적이거나 보수적이 될 수 있다.
-
ADX 지표의 매개 변수는 최적화가 필요하며, ADX 고점을 잘못 선택하면 트렌드를 놓칠 수 있다.
-
미국 달러 지수와 슈퍼 트렌드 지수 판단에 오류가 있을 수 있다.
-
너무 작은 스톱 손실은 손실을 증가시킬 수 있습니다. 너무 넓은 스톱 손실은 쉽게 고정됩니다.
더 나은 생각
-
MACD와 같은 다른 지표와 결합하여 트렌드 기점 판단을 고려할 수 있다.
-
더 많은 히스토리 데이터를 사용하여 ATR 변수 공간을 훈련하여 최적의 변수 범위를 찾습니다.
-
다양한 ADX 변수를 테스트하고, ADX 고점 판단을 최적화한다.
-
더 많은 변수를 추가하여 달러 지수와 시장의 전반적인 움직임을 판단할 수 있습니다.
-
재검토 데이터에 따라 최적의 스톱 손실을 계산한다.
-
이동 상쇄 또는 진동 상쇄로 상쇄를 고려할 수 있다.
-
포지션 크기와 포지션 주기를 계속 최적화하십시오.
요약하다
이 전략은 고전적인 이중 EMA 평행 시스템을 여러 보조 지표와 통합하여 변수를 자동으로 최적화하여 보다 완전한 추세 추적 전략을 달성한다. 이는 시장 환경의 변화에 유연하게 적응할 수 있으며, 추세를 추적하면서 위험을 제어할 수 있다. 그러나 더 나은 안정적인 수익을 얻기 위해 스톱 손실과 지표 변수에 대한 추가 테스트와 최적화가 여전히 필요하다.
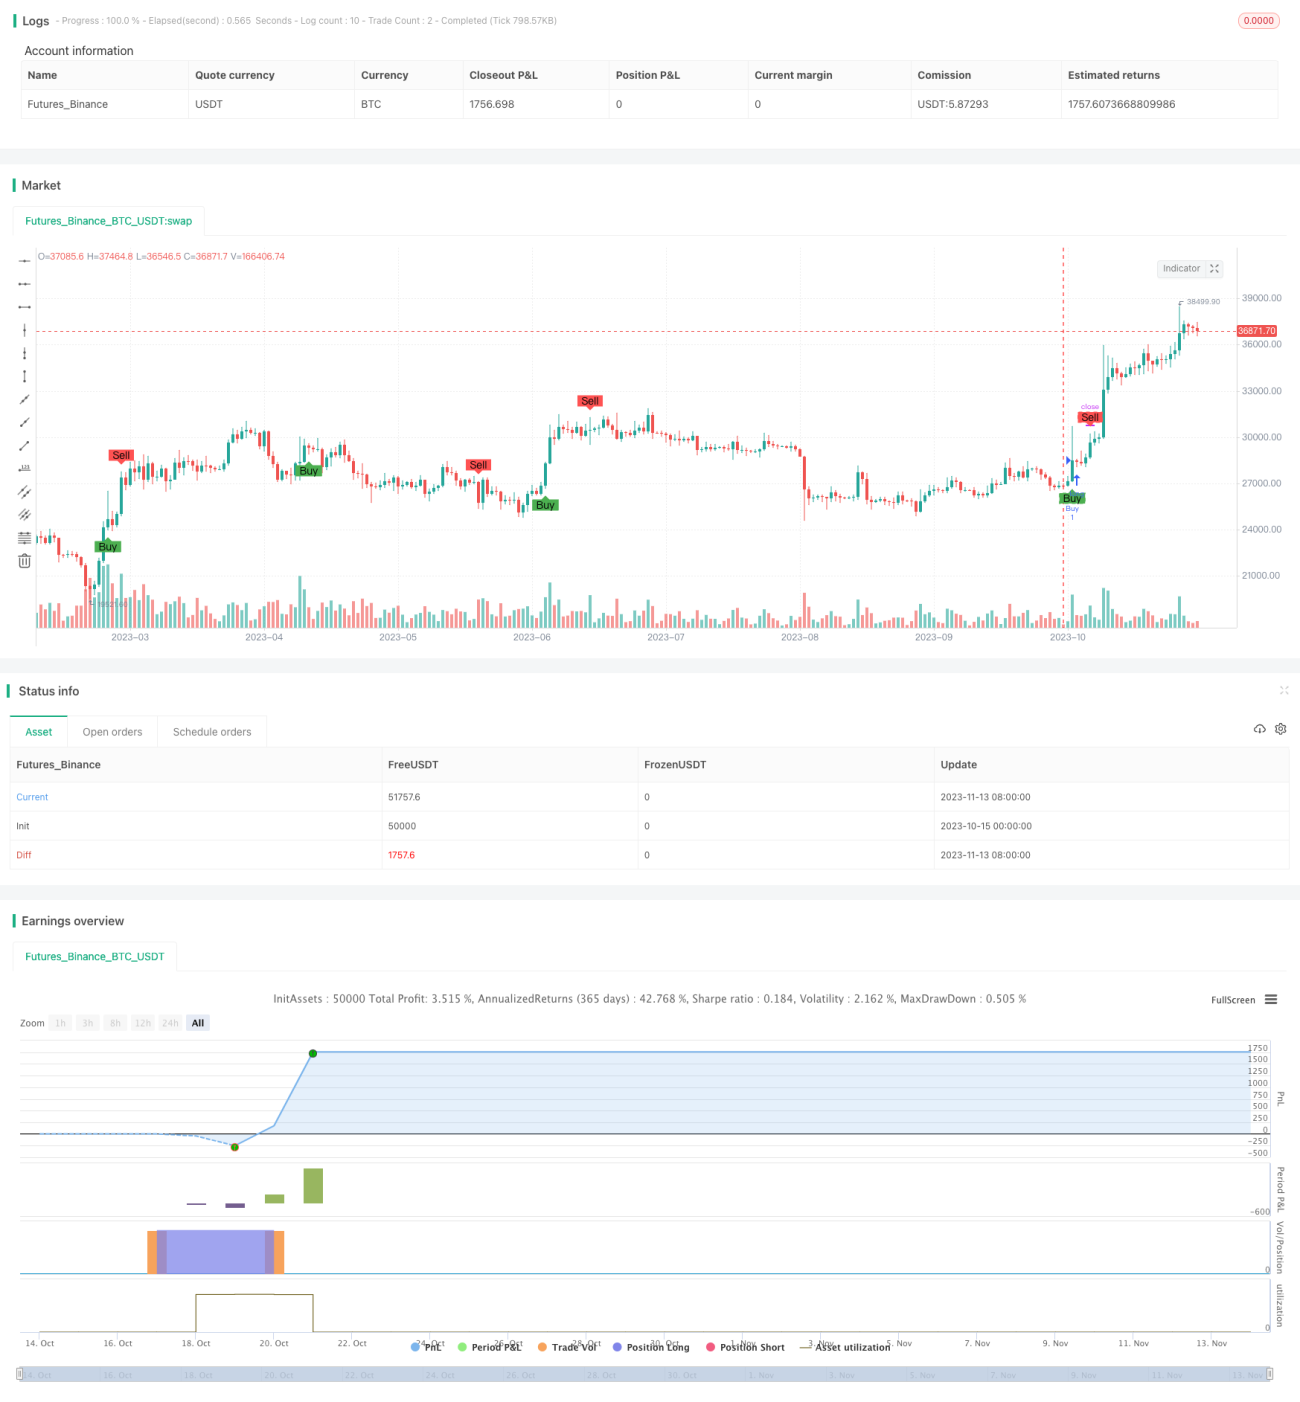
/*backtest
start: 2023-10-15 00:00:00
end: 2023-11-14 00:00:00
period: 1d
basePeriod: 1h
exchanges: [{"eid":"Futures_Binance","currency":"BTC_USDT"}]
*/

//@version=5
strategy("Refactored Advanced EMA Cross with Normalized ATR Filter, Controlling ADX", shorttitle="ALP V5", overlay=true)

// Initialize variables to track if a buy order has been placed and number of periods since the last buy- 1