개요
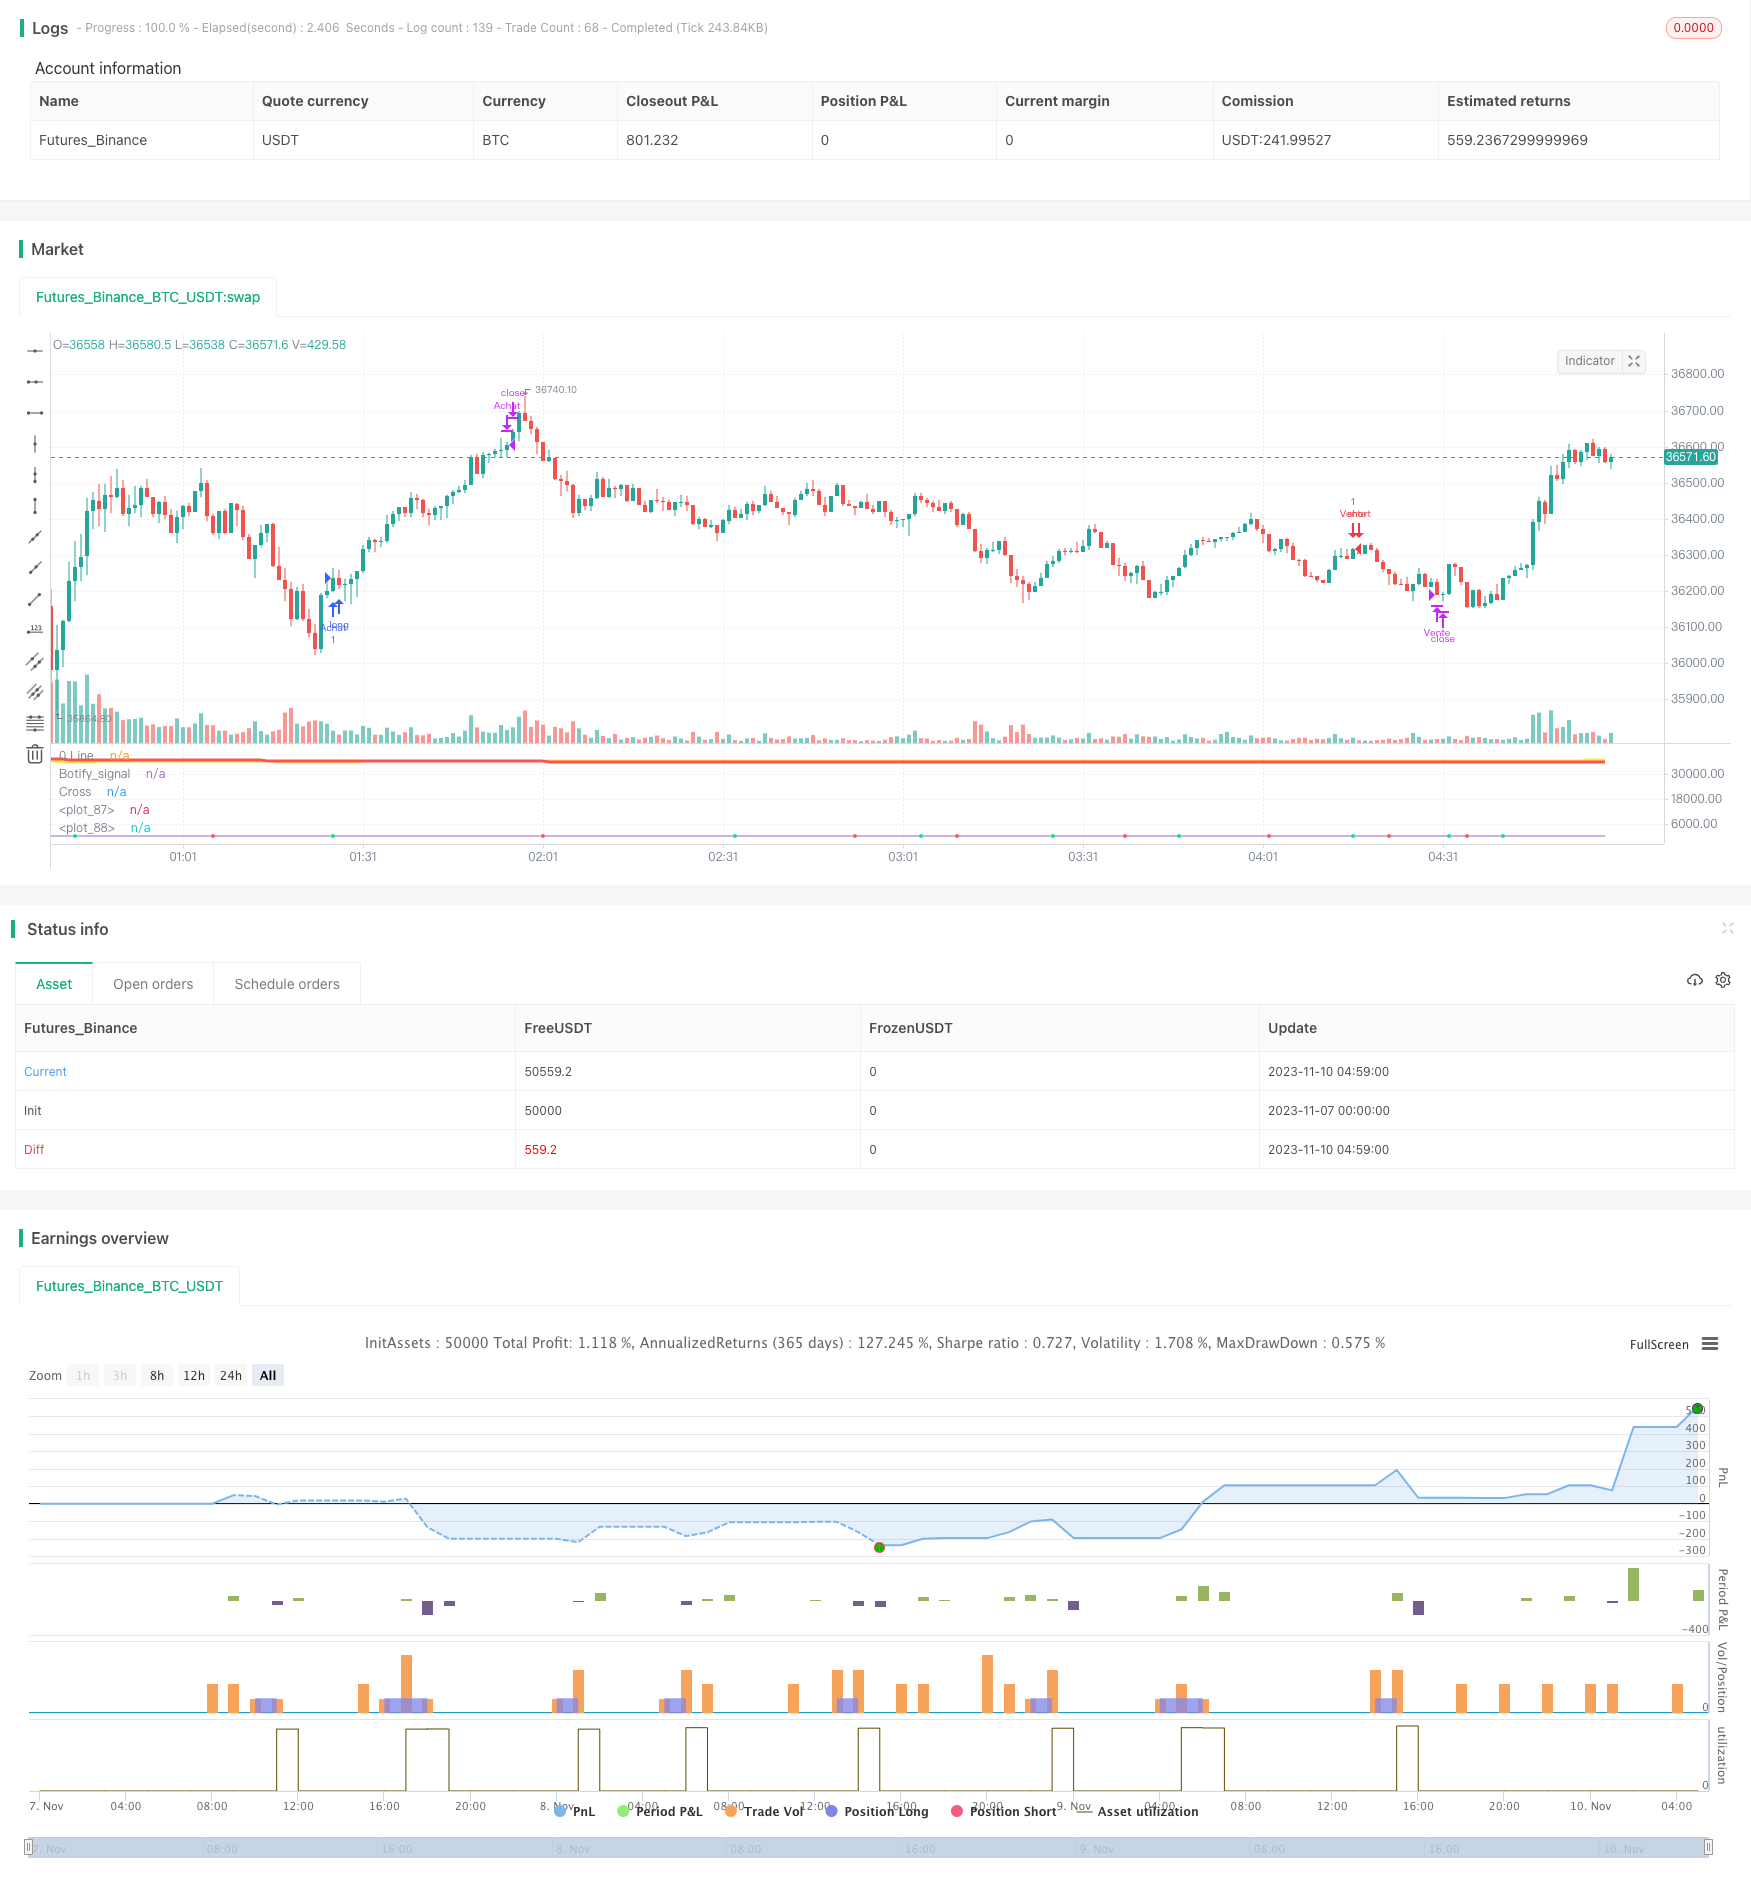
이 전략은 평균선과 MACD 지표를 결합하여 트렌드를 판단하고 거래 신호를 발산하며, 전형적인 트렌드 추적 전략에 속한다. 그것은 두 개의 다른 주기 ZLSMA 평균선을 사용하여 트렌드 방향을 판단하고, MACD 지표의 다공평선 교차와 결합하여 구체적인 구매 및 판매 신호를 발산하여 중장기 트렌드를 효과적으로 캡처 할 수 있으며, 단기 시장 소음에 의해 오해되지 않습니다.
전략 원칙
이 전략은 다음과 같은 부분들로 구성됩니다.
빠른 ZLSMA 평균선과 느린 ZLSMA 평균선: 서로 다른 주기의 ZLSMA 평균선을 비교하여 전반적인 경향 방향을 판단한다. 빠른 선은 32주기 ZLSMA로 구성되어 있고, 느린 선은 400주기 ZLSMA로 구성되어 있다. 빠른 선에서 느린 선을 통과할 때 다모양으로 보며, 반대로 보지는 않는다.
MACD 지표: 빠른 선 ((12일 EMA) 을 빼고 느린 선 ((26일 EMA) 을 어 MACD를 얻으며, 9일 EMA를 사용하여 신호선을 얻는다. MACD 상단에서 신호선을 통과하면 구매 신호이며, 아래로 이동하면 판매 신호이다.
거래 신호: ZLSMA 형태와 MACD 신호가 동방향일 때만 구매 또는 판매 신호를 발송한다. 즉, 다목적 트렌드 더하기 MACD 황금 포크 때 구매하고, 공허 트렌드 더하기 MACD 죽은 포크 때 판매한다.
스톱 로즈 스톱: 이 전략은 스톱 로즈 스톱 로직에 추가되지 않았으며, 추후 추가적인 최적화가 필요합니다.
위의 조합은 평균선을 사용하여 큰 트렌드를 판단하고, MACD는 진입 시기를 판단하여, 가짜 돌파구를 효과적으로 필터링하고, 단기 시장 소음으로 오해되는 것을 피할 수 있다.
우위 분석
이 전략은 다음과 같은 장점을 가지고 있습니다.
트렌드 캡처: 다양한 주기 평균선 조합을 통해 트렌드 방향을 판단하여 순차적으로 중장선 트렌드를 효과적으로 캡처할 수 있다.
필터링 노이즈: MACD 지표의 적용은 단기 시장 노이즈를 필터링하여 작은 범위의 흔들림에 의해 오해되는 것을 피할 수 있습니다.
매개 변수는 조정할 수 있습니다: 평균선 주기 및 MACD 변수는 사용자 정의 할 수 있으며, 다른 시장에 대해 최적화 할 수 있습니다.
실행의 편리함: 모든 지표는 일반적으로 사용되는 기술 지표이며, 조합 논리는 간단하고 명확하며 이해하기 쉽고 실행할 수 있습니다.
위험 조절: 명확한 중지 및 중지 전략으로 거래의 위험과 수익률을 제어할 수 있습니다.
위험 분석
이 전략에는 다음과 같은 위험도 있습니다.
큰 트렌드 판단 오류: 큰 트렌드 방향 판단이 잘못되면 모든 거래가 실패할 수 있습니다.
매개 변수 최적화 부적절함: 평균선 매개 변수와 MACD 매개 변수를 상세히 테스트하고 최적화해야 하며, 그렇지 않으면 효과가 좋지 않을 수 있다.
현재는 스톱포인트가 설정되어 있지 않아 손실이 너무 커질 위험이 있습니다.
수익 공간의 제한: 트렌드 추적 전략으로, 각 거래의 수익 공간은 제한되어 있으며, 더 높은 수익을 얻기 위해 양이 필요합니다.
거래 빈도가 너무 높다: 변수 설정을 잘못하면 거래 빈도가 너무 높고 거래 비용과 슬라이드 포인트 비용이 증가할 수 있다.
최적화 방향
이 전략은 다음의 몇 가지 측면에서 더 개선될 수 있습니다.
스톱로스 메커니즘에 가입: 합리적인 스톱로스를 설정하고, 단일 거래의 최대 손실을 엄격하게 제어한다.
최적화 변수: 재검토 및 최적화를 통해 최적의 평균선과 MACD 변수 조합을 찾는다.
거래 빈도를 낮추기: 트렌드가 뚜렷한 경우에만 거래 신호를 발송하도록 매개 변수를 조정한다.
다른 요소와 결합: 트렌드 및 신호를 확인하기 위해 거래량 변화와 같은 다른 요소를 추가할 수 있습니다.
입학 시기를 최적화: 입학 정확도를 높이기 위해 MACD 지표의 적용을 더욱 최적화하십시오.
여러 품종 보편성: 매개 변수를 최적화하여 전략을 다양한 품종에 광범위하게 적용할 수 있도록 하여 적용 범위를 확장한다.
요약하다
전체적으로, 이 전략은 간단한 효과적인 평행선과 MACD 지표의 조합을 통해 중장선 트렌드를 포착하고, 양적 거래의 기본 전략으로 사용할 수 있다. 그러나 더 안정적인 거래 효과를 달성하기 위해 파라미터를 추가로 최적화하고, 위험을 제어하고, 다른 요소와 결합해야 한다.
/*backtest
start: 2023-11-07 00:00:00
end: 2023-11-10 05:00:00
period: 1m
basePeriod: 1m
exchanges: [{"eid":"Futures_Binance","currency":"BTC_USDT"}]
*/

// This source code is subject to the terms of the Mozilla Public License 2.0 at https://mozilla.org/MPL/2.0/
// © veryfid

//@version=5
strategy("Stratégie ZLSMA Bruno", shorttitle="Stratégie ZLSMA Bruno", overlay=false)

source = close
useCurrentRes = input(true, title="Use Current Chart Resolution?")
smd = input(true, title="Show MacD & Signal Line? Also Turn Off Dots Below")
sd = input(true, title="Show Dots When MacD Crosses Signal Line?")
sh = input(true, title="Show Histogram?")
macd_colorChange = input(true,title="Change MacD Line Color-Signal Line Cross?")
hist_colorChange = input(true,title="MacD Histogram 4 Colors?")

//res = useCurrentRes ? period : resCustom

fastLength = input(12),
slowLength=input(26)
signalLength=input(9)

fastMA = ta.ema(source, fastLength)
slowMA = ta.ema(source, slowLength)

macd = fastMA - slowMA
signal = ta.sma(macd, signalLength)
hist = macd - signal

outMacD =  macd
outSignal = signal
outHist =  hist

histA_IsUp = outHist > outHist[1] and outHist > 0
histA_IsDown = outHist < outHist[1] and outHist > 0
histB_IsDown = outHist < outHist[1] and outHist <= 0
histB_IsUp = outHist > outHist[1] and outHist <= 0

//MacD Color Definitions
macd_IsAbove = outMacD >= outSignal
macd_IsBelow = outMacD < outSignal

//plot_color = hist_colorChange ? histA_IsUp ? aqua : histA_IsDown ? blue : histB_IsDown ? red : histB_IsUp ? maroon :yellow :gray
macd_color = macd_colorChange ? macd_IsAbove ? color.lime : color.red : color.red
//signal_color = macd_colorChange ? macd_IsAbove ? yellow : yellow : lime

circleYPosition = outSignal

//plot(smd and outMacD ? outMacD : na, title="MACD", color=macd_color, linewidth=4)
//plot(smd and outSignal ? outSignal : na, title="Signal Line", color=signal_color, style=line ,linewidth=2)
//plot(sh and outHist ? outHist : na, title="Histogram", color=plot_color, style=histogram, linewidth=4)
plot(sd and ta.cross(outMacD, outSignal) ? circleYPosition : na, title="Cross", style=plot.style_circles, linewidth=4, color=macd_color)
hline(0, '0 Line', linestyle=hline.style_solid, linewidth=2, color=color.white)

// Paramètres de la ZLSMA
length = input(32, title="Longueur")
offset = input(0, title="Décalage")
src = input(close, title="Source")
lsma = ta.linreg(src, length, offset)
lsma2 = ta.linreg(lsma, length, offset)
eq = lsma - lsma2
zlsma = lsma + eq

length_slow = input(400, title="Longueur")
offset_slow = input(0, title="Décalage")
lsma_slow = ta.linreg(src, length_slow, offset_slow)
lsma2_slow = ta.linreg(lsma_slow, length_slow, offset_slow)
eq_slow = lsma_slow - lsma2_slow
zlsma_slow = lsma_slow + eq_slow

// Paramètres de la sensibilité
sensitivity = input(0.5, title="Sensibilité")

// Règles de trading
longCondition = zlsma < zlsma_slow and  zlsma_slow < zlsma_slow[1] and zlsma > zlsma[1] and ta.cross(outMacD, outSignal) and  macd_color == color.lime//ta.crossover(zlsma, close) and ta.crossover(zlsma, zlsma[1]) // Croisement vers le haut
shortCondition = zlsma > zlsma_slow and  zlsma_slow > zlsma_slow[1] and zlsma < zlsma[1] and ta.cross(outMacD, outSignal) and  macd_color == color.lime   //ta.crossunder(zlsma, close) and ta.crossunder(zlsma, zlsma[1]) // Croisement vers le bas

// Entrée en position
strategy.entry("Achat", strategy.long, when=longCondition)
strategy.entry("Vente", strategy.short, when=shortCondition)
botifySignalZLSMA = longCondition ? 1 : shortCondition ? -1 : 0
plot(botifySignalZLSMA, title='Botify_signal', display=display.none)
// Sortie de position
strategy.close("Achat", when=ta.crossunder(zlsma, close)) // Close the "Achat" position
strategy.close("Vente", when=ta.crossover(zlsma, close)) // Close the "Vente" position


// Tracé de la courbe ZLSMA
plot(zlsma, color=color.yellow, linewidth=3)
plot(zlsma_slow, color=color.red, linewidth=3)