더블 이동 평균 교차 화살표 전략

1
Follow
1778
Followers
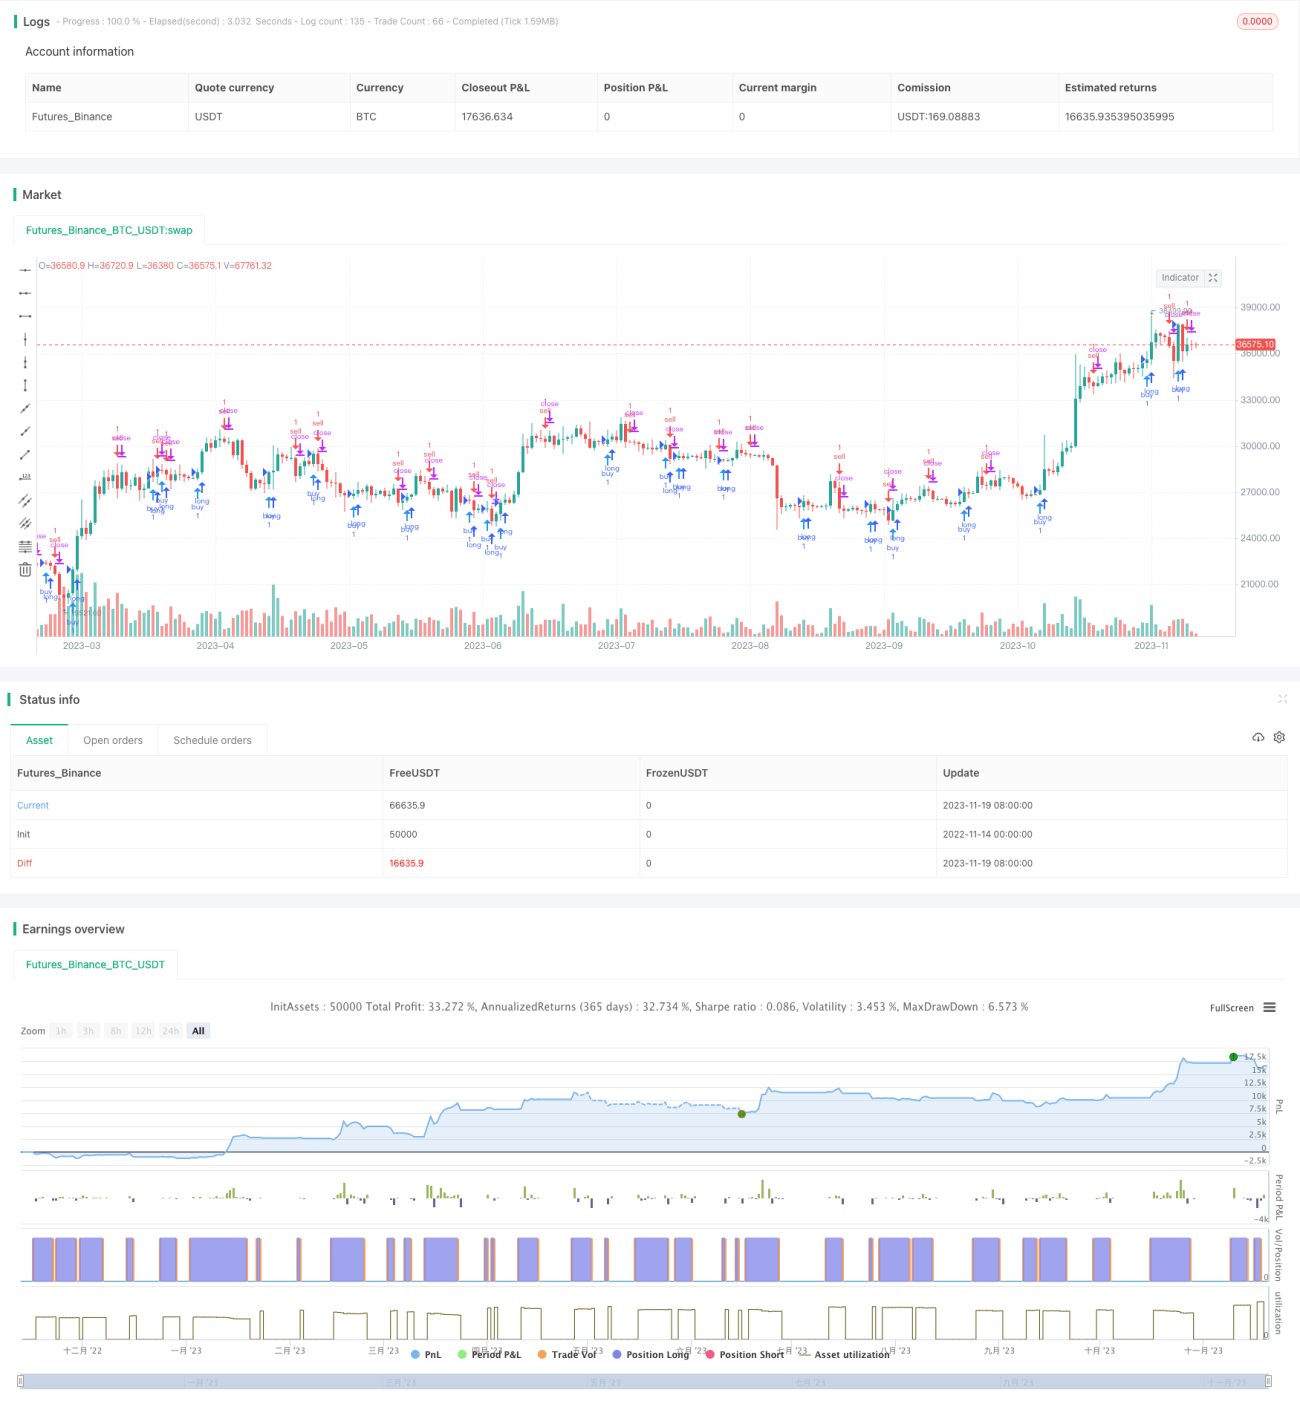
개요
이 전략은 MACD 지표의 쌍평선 교차를 계산하여 구매와 판매의 시간을 판단한다. 그것은 거래 신호를 제안하기 위해 차트에 화살 모양을 그리는 것이다.
원칙
이 전략은 먼저 패스트 라인 (EMA 12호기), 패스트 라인 (EMA 26호기) 및 MACD의 차이를 계산한다. 그리고는 패스트 라인과 패스트 라인의 골드 포크와 MACD의 차이의 양과 음을 기준으로 구매와 판매의 시간을 판단한다:
- 빠른 선에서 느린 선을 통과하고 MACD 차이는 0을 통과하면 구매 신호입니다.
- 빠른 라인 아래에서 느린 라인을 통과하고 MACD 차이는 0을 통과하면 판매 신호로
가짜 신호를 필터링하기 위해, 코드는 이전 K선의 신호 상태를 판단한다. 현재 K선 중 하나가 역전 신호 (구매가 판매로 전환되거나 판매가 구매로 전환) 인 경우에만 현재 신호가 트리거된다.
또한, K 온라인에서 구매 및 판매 시점을 알려주는 화살표가 코드에 그려져 있습니다.
장점
이 전략은 다음과 같은 장점을 가지고 있습니다.
- 쌍평선 교차 판단을 사용하여 시장 소음을 효과적으로 필터링하여 트렌드를 식별할 수 있습니다.
- MACD 미분 판단과 결합하여 미수 및 잘못된 판단을 피할 수 있습니다.
- 화살표를 이용하면 거래 시점을 알 수 있고, 더 명확하게 움직일 수 있습니다.
- 규칙은 간단하고 명확하며, 이해하기 쉽고 복제하기 쉽습니다.
위험과 해결책
이 전략에는 몇 가지 위험도 있습니다.
- 양평선 교차는 가짜 신호를 쉽게 생성하고, 과도한 거래로 이어질 수 있다. 가짜 신호를 줄이기 위해 평균선 매개 변수를 적절히 조정하거나 다른 필터링 조건을 추가할 수 있다.
- 트렌드에서의 흔들림을 판단할 수 없고, 손실이 발생할 수 있다. 트렌드 지표인 ADX와 결합하면 이러한 상황을 피할 수 있다.
- 고정된 구매 및 판매 조건은 전략을 기계화하여 시장 변화에 적응할 수 없습니다. 기계 학습과 같은 적응 방법을 시도하여 최적화 할 수 있습니다.
최적화 방향
이 전략은 다음과 같은 방향으로 최적화될 수 있습니다.
- 다양한 변수 조합을 테스트하여 최적의 빠른 선, 느린 선 및 MACD 변수를 찾아내기
- 입시 조건을 추가하여 거래량 돌파를 통해 신호를 필터링합니다.
- 단편적 손실을 통제하기 위한 손해 방지 제도를 늘립니다.
- VIX와 같은 변동률 지표와 함께 위험 선호를 판단하는 방법
- 고정된 규칙을 대신하여 전략의 적응적 최적화를 위한 기계학습 모델을 시도합니다.
요약하다
이 쌍평선 교차 화살 전략은 전체적으로 비교적 간단하고 실용적이며, 쌍평선 교차 판단과 MACD 차차 필터링을 통해 중장선 트렌드의 매매점을 식별할 수 있으며, 놓친 가격 전환을 피할 수 있다. 화살提示도 동작을 더 명확하게 명확하게 한다. 후기에는 변수 최적화, 필터링 조건을 증가시키는 등의 방법으로 전략의 안정성과 수익률을 더욱 강화할 수 있다.
Source
Pine
/*backtest
start: 2022-11-14 00:00:00
end: 2023-11-20 00:00:00
period: 1d
basePeriod: 1h
exchanges: [{"eid":"Futures_Binance","currency":"BTC_USDT"}]
*/

//@version=3
//Daniels stolen code
strategy(shorttitle="Daniels Stolen Code", title="Daniels Stolen Code", overlay=true, calc_on_order_fills=true, pyramiding=0)
Related strategies
Comment
All comments (0)
No data
- 1