트렌드 돌파 이중 이동 평균 필터 전략


생성 날짜: 2023-11-27 17:03:08 마지막으로 수정됨: 2023-11-27 17:03:08
복사: 0 클릭수: 689
avatar of ChaoZhang ChaoZhang
1
집중하다
1617
수행원

트렌드 돌파 이중 이동 평균 필터 전략

개요

이것은 평선과 브린 통로를 사용하여 트렌드를 판단하고, 필터링 및 스톱 원칙을 뚫는 전략이다. 트렌드가 변할 때 신호를 적시에 잡을 수 있으며, 쌍평선 필터링을 통해 잘못된 신호를 줄이고, 위험을 제어하기 위해 스톱을 설정할 수 있다.

전략 원칙

이 전략은 다음과 같은 부분들로 구성됩니다.

  1. 트렌드 판단: MACD를 사용하여 가격 추세를 판단하고, 다중 헤드 및 공백 트렌드를 구분한다.

  2. 범위 필터링: 부린 채널을 사용하여 가격 변동 범위를 판단하고 범위를 넘지 않는 신호를 필터링한다.

  3. 쌍평평선 확인: 빠른 EMA와 느린 EMA로 구성된 쌍평선, 트렌드 신호를 확인하기 위해 사용된다. 빠른 EMA> 느린 EMA일 때만 구매 신호가 생성된다.

  4. 손해 중지 메커니즘: 손해 중지 지점을 설정하고, 가격이 불리한 방향으로 손해 중지 지점을 돌파 할 때 청산 지점을 중지한다.

신호의 판단 논리는 다음과 같습니다.

  1. MACD는 상승 추세라고 판단했습니다.
  2. 가격 폭격이 부린 통로로 이어졌다.
  3. 빠른 EMA가 느린 EMA보다 높습니다.

3가지 조건이 동시에 충족되면 구매 신호가 발생한다.

평점 포지션 논리는 두 가지로 나뉘는데, 정지 평점 포지션과 정지 평점 포지션이다. 정지 포인트는 진입 가격에 일정 비율로 곱하며, 정지 포인트는 진입 가격에 일정 비율로 곱한다. 가격이 이 중 한 점을 돌파할 때 평점 포지션이다.

우위 분석

이 전략은 다음과 같은 장점이 있습니다.

  1. 트렌드 변화와 트레이스백이 적습니다.
  2. 쌍평선 필터링으로 오류 신호를 개선한다.
  3. 손해 방지 장치가 단편적 손실을 효과적으로 제어한다.
  4. 파라미터를 최적화할 수 있는 공간이 넓고, 최적의 상태로 조정할 수 있다.

위험 분석

이 전략에는 몇 가지 위험도 있습니다.

  1. 지진이 발생했을 때 발생하는 잘못된 신호로 인해 손실이 발생할 수 있습니다.
  2. 스톱포인트 설정이 잘못되면 불필요한 손실이 발생할 수 있습니다.
  3. 잘못된 매개 변수는 전략의 효과가 떨어질 수 있습니다.

이러한 위험에는 최적화 변수, 스톱 포지션 조정 등의 방법으로 최적화 및 개선할 수 있다.

최적화 방향

이 전략은 다음과 같은 방향으로 최적화될 수 있습니다.

  1. 양평선 길이를 조정하여 최적의 변수 조합을 찾습니다.
  2. 추적 손실, 진동 손실 등 다양한 손실을 막는 방법을 테스트하십시오.
  3. MACD 변수를 테스트하여 최적의 변수를 찾습니다.
  4. 기계학습을 사용하여 매개 변수를 자동으로 최적화한다.
  5. 추가 조건 필터링 신호를 추가하십시오.

다양한 파라미터 설정을 테스트하여 수익률과 샤프 비율을 평가하여 이 전략의 최적의 상태를 찾을 수 있다.

요약하다

이것은 트렌드 판단, 범위 필터링, 쌍평선 확인 및 상쇄 사고를 이용한 양적 전략이다. 그것은 트렌드 방향을 효과적으로 판단하고 수익 극대화와 위험 제어 사이의 균형을 찾을 수 있다. 매개 변수 최적화 및 기계 학습과 같은 방법으로, 이 전략에는 더 나은 효과를 얻을 수 있는 많은 개선 공간이 있다.
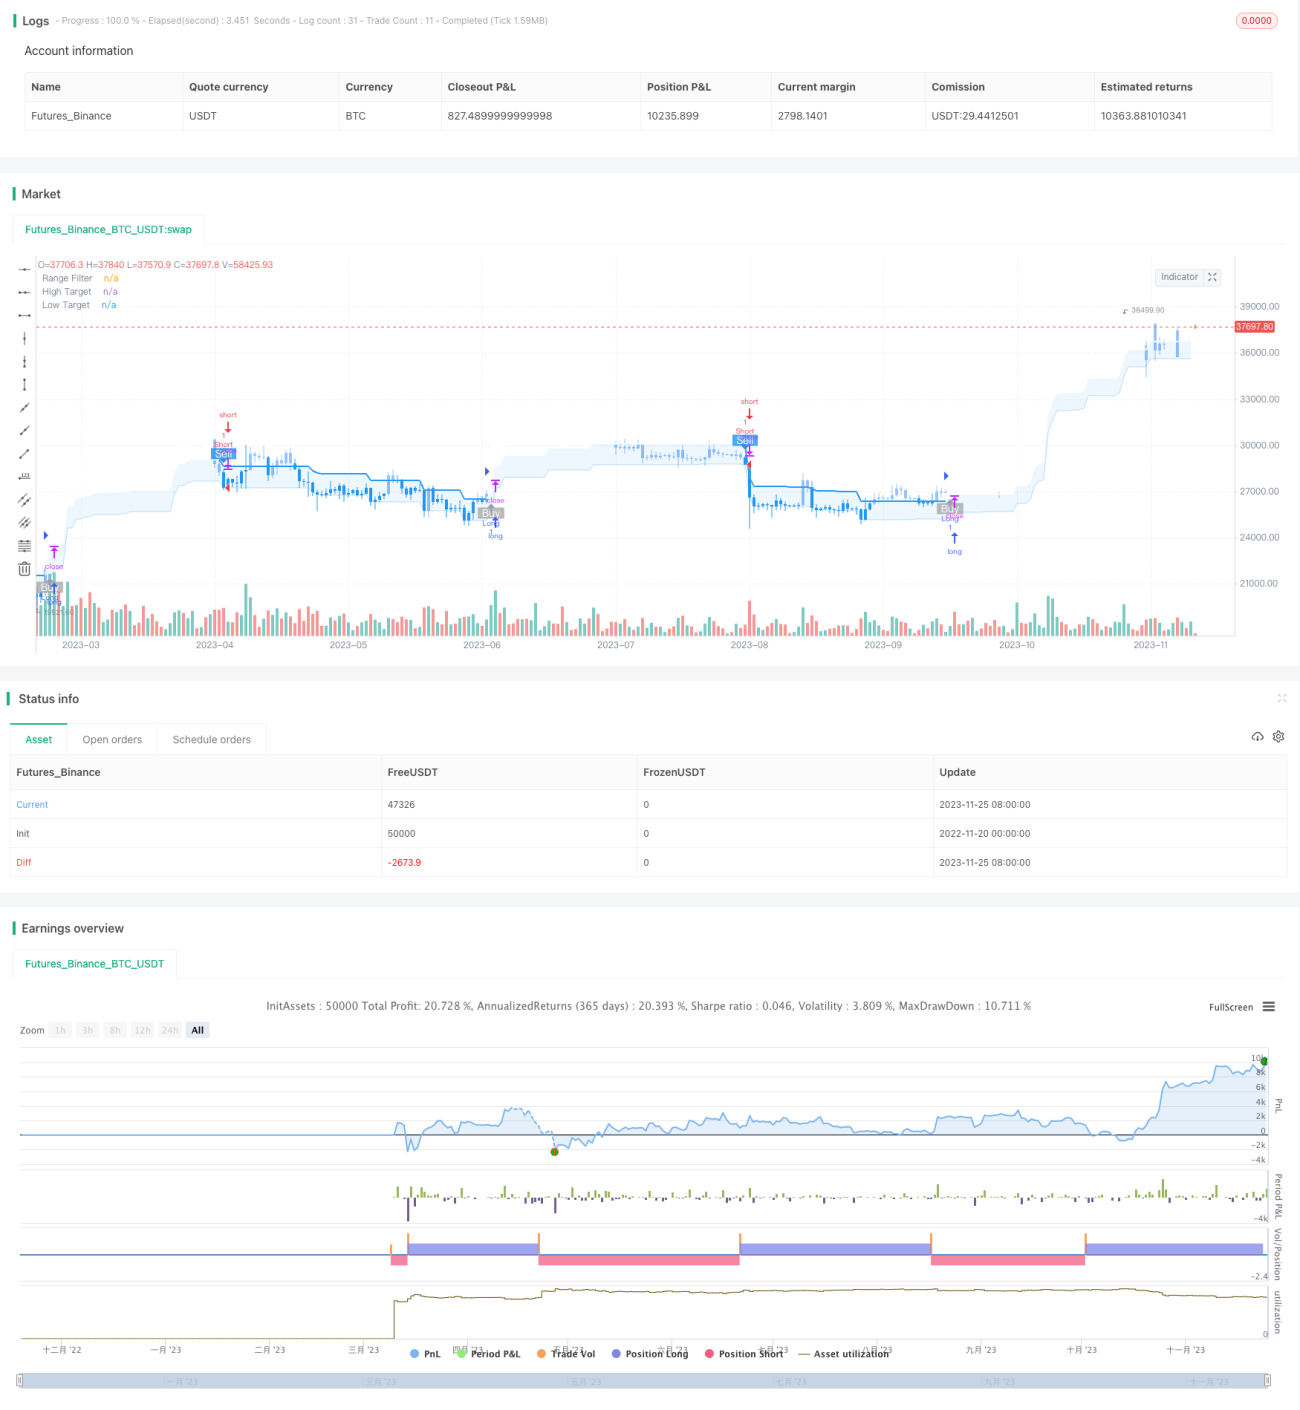
전략 소스 코드
/*backtest
start: 2022-11-20 00:00:00
end: 2023-11-26 00:00:00
period: 1d
basePeriod: 1h
exchanges: [{"eid":"Futures_Binance","currency":"BTC_USDT"}]
*/

//@version=5
strategy(title="Range Filter Buy and Sell Strategies", shorttitle="Range Filter Strategies", overlay=true,pyramiding = 5)

// Original Script > @DonovanWall
// Adapted Version > @guikroth
// 
// Updated PineScript to version 5
// Republished by > @tvenn
// Strategizing by > @RonLeigh
//////////////////////////////////////////////////////////////////////////
// Settings for 5min chart, BTCUSDC. For Other coin, change the parameters
//////////////////////////////////////////////////////////////////////////


SS = input.bool(false,"Percentage Take Profit Stop Loss")


longProfitPerc = input.float(title='LongProfit(%)', minval=0.0, step=0.1, defval=1.5) * 0.01

shortProfitPerc = input.float(title='ShortProfit(%)', minval=0.0, step=0.1, defval=1.5) * 0.01


longLossPerc = input.float(title='LongStop(%)', minval=0.0, step=0.1, defval=1.5) * 0.01

shortLossPerc = input.float(title='ShortStop(%)', minval=0.0, step=0.1, defval=1.5) * 0.01


// Color variables
upColor   = color.white
midColor  = #90bff9
downColor = color.blue

// Source
src = input(defval=close, title="Source")

// Sampling Period
// Settings for 5min chart, BTCUSDC. For Other coin, change the paremeters
per = input.int(defval=100, minval=1, title="Sampling Period")

// Range Multiplier
mult = input.float(defval=3.0, minval=0.1, title="Range Multiplier")

// Smooth Average Range
smoothrng(x, t, m) =>
    wper = t * 2 - 1
    avrng = ta.ema(math.abs(x - x[1]), t)
    smoothrng = ta.ema(avrng, wper) * m
    smoothrng
smrng = smoothrng(src, per, mult)

// Range Filter
rngfilt(x, r) =>
    rngfilt = x
    rngfilt := x > nz(rngfilt[1]) ? x - r < nz(rngfilt[1]) ? nz(rngfilt[1]) : x - r : 
       x + r > nz(rngfilt[1]) ? nz(rngfilt[1]) : x + r
    rngfilt
filt = rngfilt(src, smrng)

// Filter Direction
upward = 0.0
upward := filt > filt[1] ? nz(upward[1]) + 1 : filt < filt[1] ? 0 : nz(upward[1])
downward = 0.0
downward := filt < filt[1] ? nz(downward[1]) + 1 : filt > filt[1] ? 0 : nz(downward[1])

// Target Bands
hband = filt + smrng
lband = filt - smrng

// Colors
filtcolor = upward > 0 ? upColor : downward > 0 ? downColor : midColor
barcolor = src > filt and src > src[1] and upward > 0 ? upColor :
   src > filt and src < src[1] and upward > 0 ? upColor : 
   src < filt and src < src[1] and downward > 0 ? downColor : 
   src < filt and src > src[1] and downward > 0 ? downColor : midColor

filtplot = plot(filt, color=filtcolor, linewidth=2, title="Range Filter")

// Target
hbandplot = plot(hband, color=color.new(upColor, 70), title="High Target")
lbandplot = plot(lband, color=color.new(downColor, 70), title="Low Target")

// Fills
fill(hbandplot, filtplot, color=color.new(upColor, 90), title="High Target Range")
fill(lbandplot, filtplot, color=color.new(downColor, 90), title="Low Target Range")

// Bar Color
barcolor(barcolor)

// Break Outs
longCond = bool(na)
shortCond = bool(na)
longCond := src > filt and src > src[1] and upward > 0 or 
   src > filt and src < src[1] and upward > 0
shortCond := src < filt and src < src[1] and downward > 0 or 
   src < filt and src > src[1] and downward > 0

CondIni = 0
CondIni := longCond ? 1 : shortCond ? -1 : CondIni[1]
longCondition = longCond and CondIni[1] == -1
shortCondition = shortCond and CondIni[1] == 1


// alertcondition(longCondition, title="Buy alert on Range Filter", message="Buy alert on Range Filter")
// alertcondition(shortCondition, title="Sell alert on Range Filter", message="Sell alert on Range Filter")
// alertcondition(longCondition or shortCondition, title="Buy and Sell alert on Range Filter", message="Buy and Sell alert on Range Filter")


////////////// 副

sensitivity = input(150, title='Sensitivity')
fastLength = input(20, title='FastEMA Length')
slowLength = input(40, title='SlowEMA Length')
channelLength = input(20, title='BB Channel Length')
multt = input(2.0, title='BB Stdev Multiplier')

DEAD_ZONE = nz(ta.rma(ta.tr(true), 100)) * 3.7

calc_macd(source, fastLength, slowLength) =>
    fastMA = ta.ema(source, fastLength)
    slowMA = ta.ema(source, slowLength)
    fastMA - slowMA

calc_BBUpper(source, length, multt) =>
    basis = ta.sma(source, length)
    dev = multt * ta.stdev(source, length)
    basis + dev

calc_BBLower(source, length, multt) =>
    basis = ta.sma(source, length)
    dev = multt * ta.stdev(source, length)
    basis - dev

t1 = (calc_macd(close, fastLength, slowLength) - calc_macd(close[1], fastLength, slowLength)) * sensitivity

e1 = calc_BBUpper(close, channelLength, multt) - calc_BBLower(close, channelLength, multt)

trendUp = t1 >= 0 ? t1 : 0
trendDown = t1 < 0 ? -1 * t1 : 0

duoad = trendUp > 0 and trendUp > e1

kongad = trendDown > 0 and trendDown > e1


duo =  longCondition and duoad

kong = shortCondition and kongad


//Alerts
plotshape(longCondition  and trendUp > e1 and  trendUp > 0 , title="Buy Signal", text="Buy", textcolor=color.white, style=shape.labelup, size=size.small, location=location.belowbar, color=color.new(#aaaaaa, 20))
plotshape(shortCondition  and trendDown > e1 and  trendDown > 0 , title="Sell Signal", text="Sell", textcolor=color.white, style=shape.labeldown, size=size.small, location=location.abovebar, color=color.new(downColor, 20))


if  longCondition and trendUp > e1 and  trendUp > 0 
    strategy.entry('Long',strategy.long, comment = "buy" )

if  shortCondition and trendDown > e1 and  trendDown > 0 
    strategy.entry('Short',strategy.short, comment = "sell" )


longlimtPrice  = strategy.position_avg_price * (1 + longProfitPerc)
shortlimtPrice = strategy.position_avg_price * (1 - shortProfitPerc)
   
longStopPrice  = strategy.position_avg_price * (1 - longLossPerc)
shortStopPrice = strategy.position_avg_price * (1 + shortLossPerc)


if (strategy.position_size > 0)  and SS == true
    
    strategy.exit(id="Long",comment_profit = "Profit",comment_loss = "StopLoss", stop=longStopPrice,limit = longlimtPrice)
    

if (strategy.position_size < 0)  and SS == true
    
    strategy.exit(id="Short",comment_profit = "Profit",comment_loss = "StopLoss", stop=shortStopPrice,limit = shortlimtPrice)