다중 요인 RSI 반전 전략

개요
이 전략은 RSI 지표를 사용하여 과매매 현상을 식별하고, MACD, 스토카스틱 지표와 같은 여러 보조 요소와 결합하여 출전한다. 이 전략은 단기 반전 기회를 잡기 위해 고안되었으며, 반전 전략에 속한다.
전략 원칙
이 전략은 주로 RSI 지표를 사용하여 시장이 과매매 또는 과매 상태에 있는지 여부를 판단한다. RSI 지표가 설정된 과매선을 초과하면 시장이 과매매 상태에 있을 가능성을 나타냅니다. 이 때 전략은 공백을 선택한다. RSI 지표가 설정된 과매선을 초과하면 시장이 과매 상태에 있을 가능성을 나타냅니다. 이 때 전략은 더 많은 것을 선택한다.
또한, 전략은 MACD, Stochastic 등 여러 보조 인자를 도입한다. 이러한 보조 인자의 역할은 발생할 수 있는 거짓 긍정적 거래 신호를 필터링한다. RSI 지표가 신호를 냈을 때만, 보조 인자가 그 신호를 지원할 때만, 전략은 진정한 거래 조치를 취한다. 이러한 다중 인자 조합 방식은 전략 신호의 신뢰도를 높일 수 있으며, 전략의 안정성을 향상시킵니다.
우위 분석
이 전략의 가장 큰 장점은 캡처 효율이 높고, 멀티 인자 검증을 구현하여 신호 품질이 향상되었다는 것이다. 구체적으로 다음과 같은 몇 가지 측면에서 주로 나타난다:
- RSI 지표 자체는 시장 체제를 인식하는 능력이 강하여 과매매 현상을 효과적으로 식별 할 수 있습니다.
- 여러 보조 도구를 통해 다중 인자 검증을 수행하여 신호 품질을 향상시키고 많은 양의 거짓 양성자를 필터링합니다.
- 정책은 변수에 민감하지 않고, 쉽게 최적화할 수 있다.
위험과 해결책
이 전략은 두 가지 측면에서 위험성을 가지고 있습니다.
- 역전 실패 위험. 역전 신호 자체는 개별 역전 실패의 확률을 배제하지 않고 통계적 중개 기회에 의존합니다. 포지션을 낮추거나 손실을 중지하여 위험을 제어 할 수 있습니다.
- 다단 상황에서의 손실 위험. 전략 전체적으로 역시장 조작이 주력으로, 다단 상황에서는 필연적으로 손실이 발생할 수 있습니다. 이것은 우리가 큰 추세를 정확하게 판단하고, 필요한 경우 인위적 개입을 통해 불리한 시장 환경을 뛰어넘는 것이 필요합니다.
최적화 방향
이 전략은 다음의 몇 가지 측면에서 개선될 필요가 있습니다.
- 다양한 품종을 테스트하여 최적의 변수 조합을 찾는다. 전략은 변수에 민감하지 않지만, 여전히 다양한 품종을 대상으로 최적의 변수를 찾는다.
- 적응적 탈퇴 메커니즘을 추가한다. 동적 중단, 시간 탈퇴 등의 방법을 추가하여 전략을 더 시장 변화에 적응시킬 수 있다.
- 기계 학습 알고리즘을 도입한다. 모델 학습을 통해 역전 성공 가능성을 판단하여 전략의 승률을 높일 수 있다.
요약하다
이 전략은 전체적으로 단선 역전 전략이다. RSI 지표를 사용하여 과매매 과매매 능력을 판단하고, 여러 보조 도구를 사용하여 다중 인자 검증을 수행하여 신호의 품질을 향상시킵니다. 이 전략은 캡처 효율이 높고 안정성이 더 좋다.
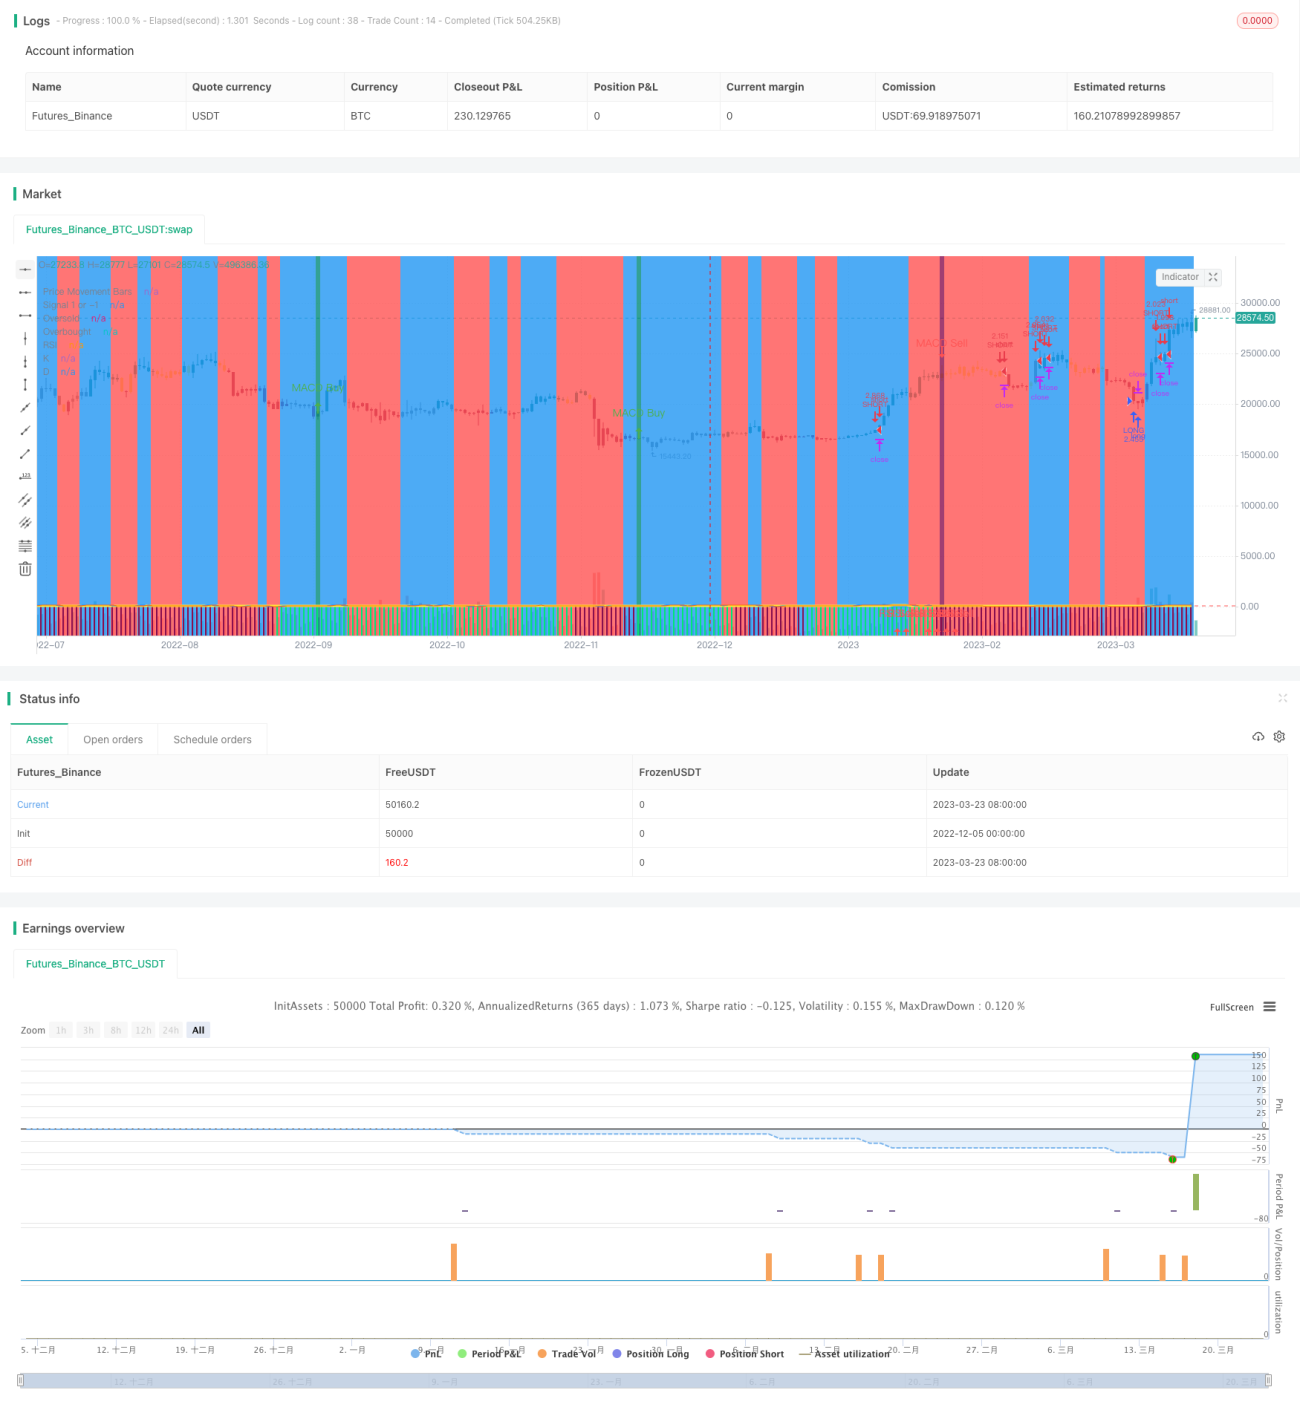
/*backtest
start: 2022-12-05 00:00:00
end: 2023-03-24 00:00:00
period: 1d
basePeriod: 1h
exchanges: [{"eid":"Futures_Binance","currency":"BTC_USDT"}]
*/

// This source code is subject to the terms of the Mozilla Public License 2.0 at https://mozilla.org/MPL/2.0/
//@version=4

strategy(shorttitle='Ain1',title='All in One Strategy', overlay=true, initial_capital = 1000, process_orders_on_close=true, default_qty_type = strategy.percent_of_equity, default_qty_value = 100, commission_type=strategy.commission.percent, commission_value=0.18, calc_on_every_tick=true)- 1