
이동 평균 반발 전략은 가격이 이동 평균을 돌파하는 것을 추적하는 전략이다. 그것은 이 이동 평균 아래에서 반발하는지 여부를 검사한다. 만약 그렇다면, 다중 신호이다. 만약 이 이동 평균 상쪽 방향에서 아래로 반발한다면, 공중 신호이다.
Exponential Moving Average Bounce Strategy
이 전략은 기하급수적인 이동 평균 (지수 이동 평균) 을 기반으로 합니다. 그것은 실시간으로 EMA 라인을 계산합니다.
이런 반발은 전략의 시작 신호입니다.
EMA 반발 전략은 가격 반전이 확인된 후에만 진입할 수 있으며, 역동작업이 잡히지 않도록 할 수 있다.
인덱스 이동 평균을 사용함으로써 가격 데이터를 효과적으로 평형화하고 시장 소음을 필터링하여 전략의 회귀가 작고 역사적 수익이 더 좋습니다.
EMA 반발 전략은 이동 평균에만 의존하며, 매우 간단하고 직설적이며, 초보자도 쉽게 이해할 수 있습니다. 또한 EMA 주기 파라미터는 다양한 품종에 따라 유연하게 조정할 수 있습니다.
EMA 라인 근처에는 종종 밀집된 가짜 돌파구가 존재하여 잘못된 신호를 유발할 수 있다. 이러한 잡음을 필터링하기 위해 EMA 파라미터를 조정해야 한다.
이 전략은 본질적으로 하향 조작이다. 가격 전환점을 예측할 수 없으며, 추세를 따라갈 수 있다. 이것은 주기적으로 조정을 놓칠 수 있는 가장 좋은 출입 시점이다.
이동 평균 근처의 스톱 로드는 때때로 뚫려 손실이 확대된다. 이것은 더 유연한 스톱 방법을 사용해야 한다.
RSI, MACD 등과 같은 다른 지표가 추가되어 가격 반전을 확인하고 가짜 신호를 필터링 할 수 있습니다.
타격의 위험을 줄이기 위해 시간 상쇄, 진동 상쇄와 같은 더 유연한 상쇄 방법을 사용할 수 있습니다.
EMA 주기 파라미터를 최적화하여 최적의 파라미터 조합을 찾습니다. 또한 EMA 파라미터를 동적으로 변경하여 시장 사이클을 추적 할 수 있습니다.
이동 평균 반발 전략은 간단하고 실용적인 트렌드 추적 전략이다. 그것은 점진적으로 작동하고, 회귀는 작고, 이해하기 쉽다. 또한 약간의 잘못된 신호 위험과 중단 위험도 존재한다. 우리는 더 나은 지표 조합, 중단 방법, 파라미터 선택을 통해 이 전략을 최적화하여 안정적이고 신뢰할 수있는 양적 전략이 될 수 있다.
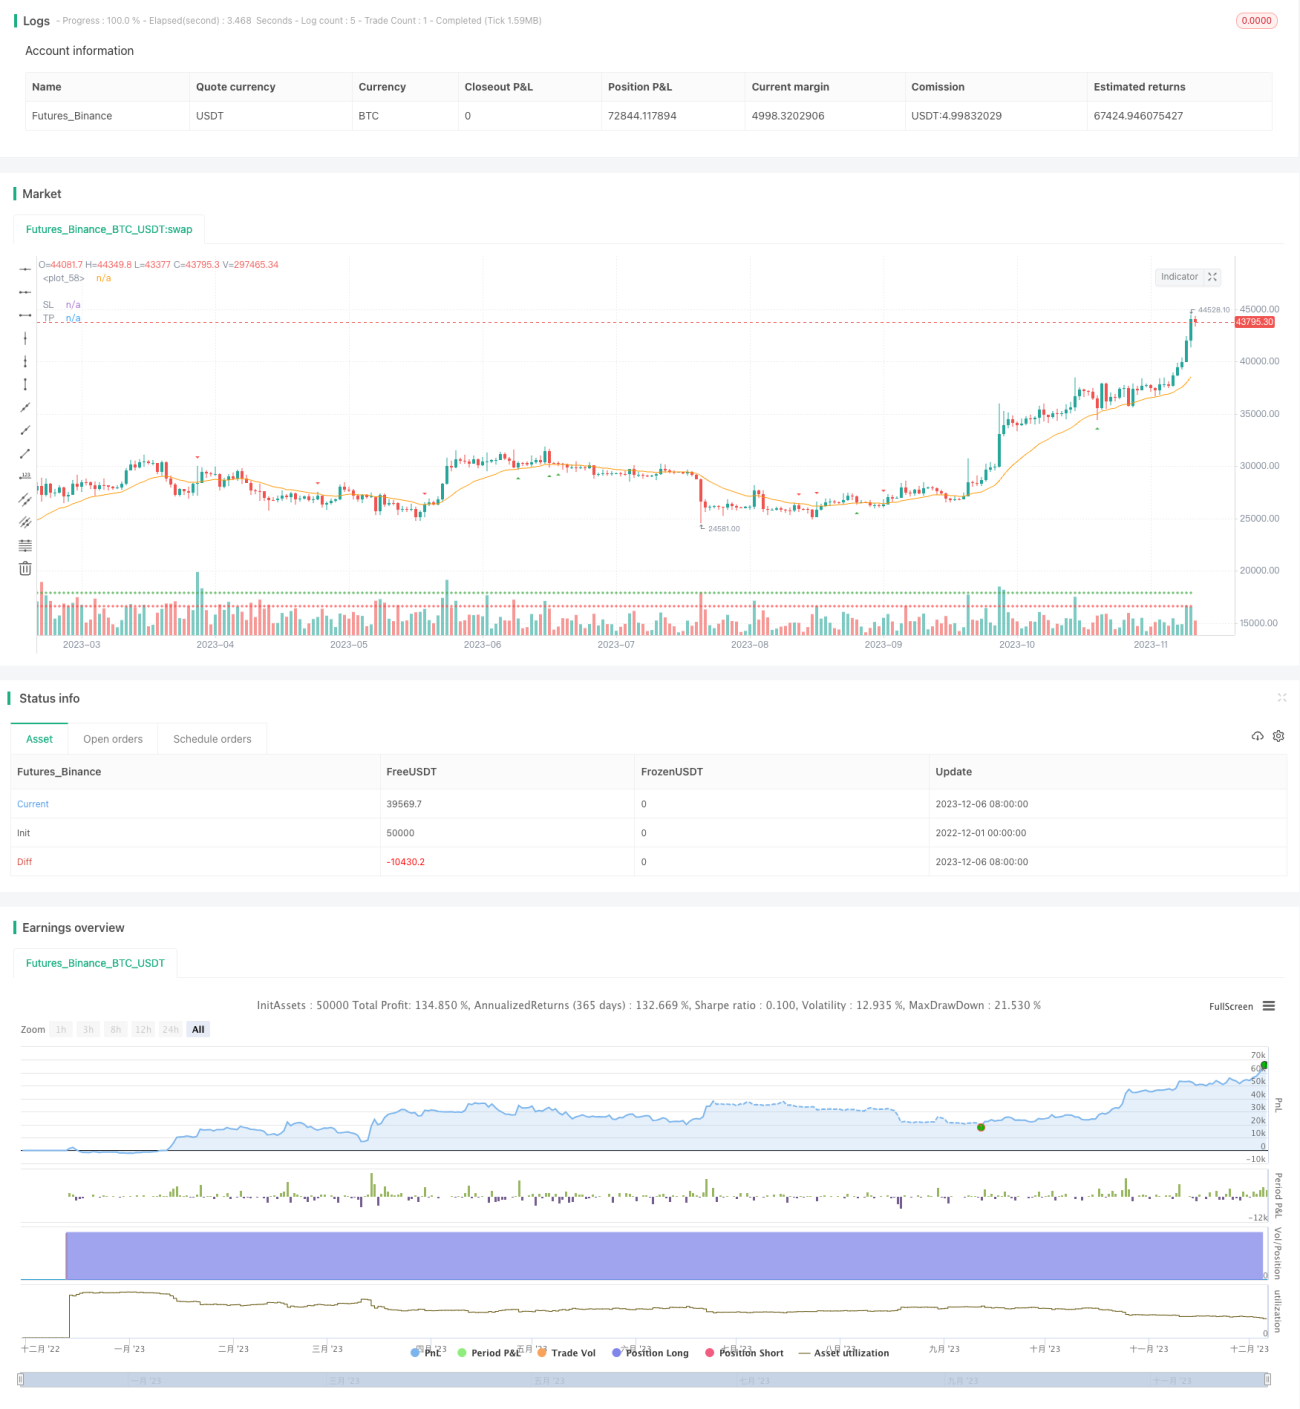
/*backtest
start: 2022-12-01 00:00:00
end: 2023-12-07 00:00:00
period: 1d
basePeriod: 1h
exchanges: [{"eid":"Futures_Binance","currency":"BTC_USDT"}]
*/
// This source code is subject to the terms of the Mozilla Public License 2.0 at https://mozilla.org/MPL/2.0/
// © tweakerID
// Simple strategy that checks for price bounces over an Exponential Moving Average. If the CLOSE of the candle bounces
// back from having it's LOW below the EMA, then it's a Bull Bounce. If the CLOSE of the candle bounces down from having it's
// high above the EMA, then it's a Bear Bounce. This logic can be reverted.
//@version=4
strategy("EMA Bounce", overlay=true,
default_qty_type=strategy.percent_of_equity,
default_qty_value=100,
initial_capital=10000,
commission_value=0.04,
calc_on_every_tick=false,
slippage=0)
direction = input(0, title = "Strategy Direction", type=input.integer, minval=-1, maxval=1)
strategy.risk.allow_entry_in(direction == 0 ? strategy.direction.all : (direction < 0 ? strategy.direction.short : strategy.direction.long))
/////////////////////// STRATEGY INPUTS ////////////////////////////////////////
title1=input(true, "-----------------Strategy Inputs-------------------")
i_EMA=input(20, title="EMA Length")
/////////////////////// BACKTESTER /////////////////////////////////////////////
title2=input(true, "-----------------General Inputs-------------------")
// Backtester General Inputs
i_SL=input(true, title="Use Swing Stop Loss and Take Profit")
i_SPL=input(defval=10, title="Swing Point Loopback")
i_PercIncrement=input(defval=.2, step=.1, title="Swing Point SL Perc Increment")*0.01
i_TPRRR = input(1.2, step=.1, title="Take Profit Risk Reward Ratio")
// Bought and Sold Boolean Signal
bought = strategy.position_size > strategy.position_size[1]
or strategy.position_size < strategy.position_size[1]
// Price Action Stop and Take Profit
LL=(lowest(i_SPL))*(1-i_PercIncrement)
HH=(highest(i_SPL))*(1+i_PercIncrement)
LL_price = valuewhen(bought, LL, 0)
HH_price = valuewhen(bought, HH, 0)
entry_LL_price = strategy.position_size > 0 ? LL_price : na
entry_HH_price = strategy.position_size < 0 ? HH_price : na
tp=strategy.position_avg_price + (strategy.position_avg_price - entry_LL_price)*i_TPRRR
stp=strategy.position_avg_price - (entry_HH_price - strategy.position_avg_price)*i_TPRRR
/////////////////////// STRATEGY LOGIC /////////////////////////////////////////
EMA=ema(close, i_EMA)
LowAboveEMA=low > EMA
LowBelowEMA=low < EMA
HighAboveEMA=high > EMA
HighBelowEMA=high < EMA
BullBounce=LowAboveEMA[1] and LowBelowEMA and close > EMA //and close > open
BearBounce=HighBelowEMA[1] and HighAboveEMA and close < EMA //and close < open
plot(EMA)
BUY=BullBounce
SELL=BearBounce
//Inputs
DPR=input(false, "Allow Direct Position Reverse")
reverse=input(false, "Reverse Trades")
// Entries
if reverse
if not DPR
strategy.entry("long", strategy.long, when=SELL and strategy.position_size == 0)
strategy.entry("short", strategy.short, when=BUY and strategy.position_size == 0)
else
strategy.entry("long", strategy.long, when=SELL)
strategy.entry("short", strategy.short, when=BUY)
else
if not DPR
strategy.entry("long", strategy.long, when=BUY and strategy.position_size == 0)
strategy.entry("short", strategy.short, when=SELL and strategy.position_size == 0)
else
strategy.entry("long", strategy.long, when=BUY)
strategy.entry("short", strategy.short, when=SELL)
SL=entry_LL_price
SSL=entry_HH_price
TP=tp
STP=stp
strategy.exit("TP & SL", "long", limit=TP, stop=SL, when=i_SL)
strategy.exit("TP & SL", "short", limit=STP, stop=SSL, when=i_SL)
/////////////////////// PLOTS //////////////////////////////////////////////////
plot(strategy.position_size > 0 ? SL : na , title='SL', style=plot.style_cross, color=color.red)
plot(strategy.position_size < 0 ? SSL : na , title='SSL', style=plot.style_cross, color=color.red)
plot(strategy.position_size > 0 ? TP : na, title='TP', style=plot.style_cross, color=color.green)
plot(strategy.position_size < 0 ? STP : na, title='STP', style=plot.style_cross, color=color.green)
// Draw price action setup arrows
plotshape(BUY ? 1 : na, style=shape.triangleup, location=location.belowbar,
color=color.green, title="Bullish Setup", transp=80, size=size.auto)
plotshape(SELL ? 1 : na, style=shape.triangledown, location=location.abovebar,
color=color.red, title="Bearish Setup", transp=80, size=size.auto)