ATR 채널 이동평균 반전을 기반으로 한 양적 거래 전략

1
Follow
1778
Followers
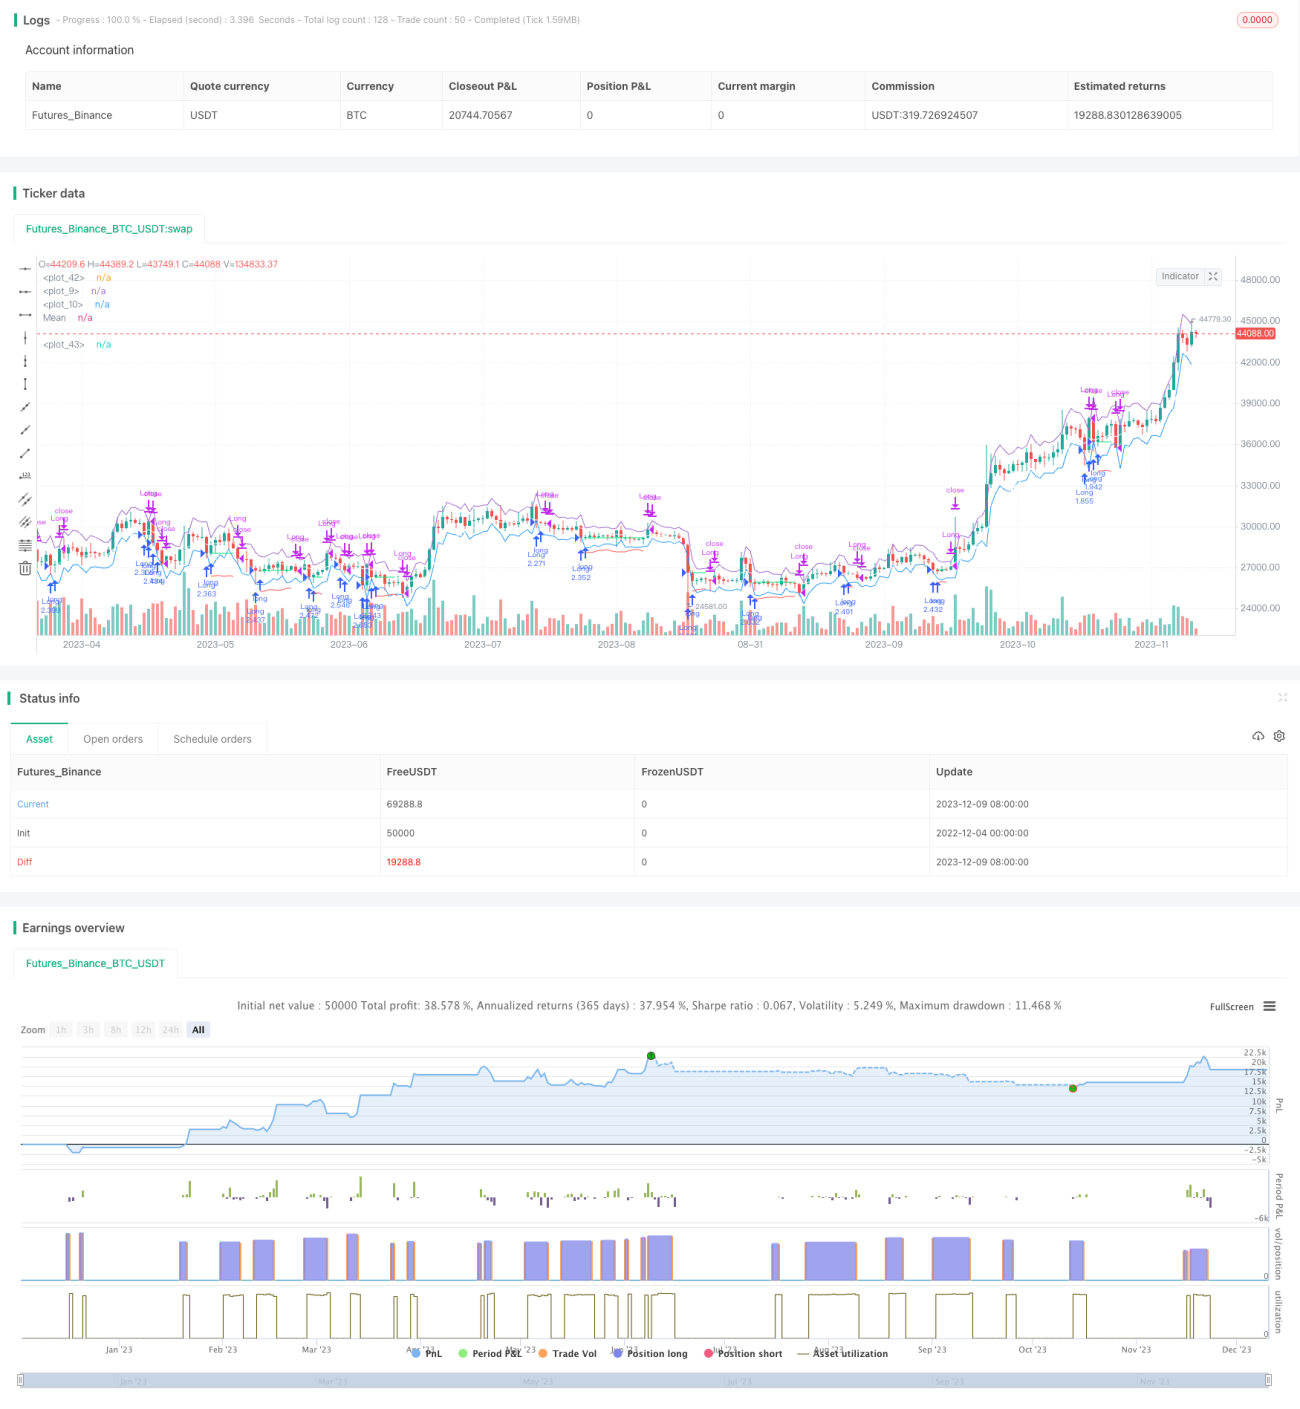
개요
이 전략은 단지 더 많은 것을 하는 전략이며, ATR 통로의 하위 경계를 깨는 가격을 이용해서 진입 시기를 결정하고, ATR 통로의 평균선이나 ATR 통로의 상위 경계를 차단으로 퇴출한다. 동시에, ATR을 이용해서 스톱로스 가격을 계산한다. 이 전략은 빠른 단선 거래에 적합하다.
전략 원칙
가격이 ATR 통로의 하위 한계를 넘으면, 가격이 비정상적으로 떨어지는 것을 나타냅니다. 이 때 전략은 다음 K 라인 개시 시에 더 많은 입구를합니다. 중단 가격은 입구 가격으로 ATR의 중지 인수를 ATR으로 곱합니다.
특히, 이 전략은 다음과 같은 논리를 포함하고 있습니다.
- ATR 및 ATR 통로의 평균선을 계산
- 시간 필터링 조건을 정의합니다.
- ATR 통로의 하위 한계 이하의 가격에 표시하면 추가 입장이 가능합니다.
- 다음 K 선이 열릴 때 더 많은 진입을 하세요.
- 입장료 기록
- 스톱로스 가격을 계산합니다.
- ATR 통로의 평균선 또는 ATR 통로의 상한보다 가격이 높을 때 매매 중지
- 가격이 스톱로스 가격보다 낮을 때 스톱로스가 탈퇴합니다.
우위 분석
이 전략은 다음과 같은 장점을 가지고 있습니다.
- ATR 통로를 사용하여 입구와 정지를 확인하고 신뢰성이 높습니다.
- 이럴 경우, 상위권에 진입하기 전에 비정상적으로 하락하는 것을 피해야 합니다.
- 엄격한 손해 방지 규칙과 효과적인 위험 관리
- 빠른 단선 거래에 적합하며, 장기간 지분을 보유할 필요가 없습니다.
- 간단하고 이해하기 쉬운 규칙, 쉽게 실행하고 최적화할 수 있습니다.
위험 분석
이 전략에는 몇 가지 위험도 있습니다.
- 자주 거래하는 거래 수수료와 슬라이드 포인트 위험
- 연쇄적으로 작동되는 정지상태가 발생할 수 있습니다.
- 변수 최적화가 잘못되면 정책 효과에 영향을 미칠 수 있습니다.
- 지표의 가격 변동이 큰 경우, 절감 손실이 너무 커질 수 있습니다.
ATR 주기를 조정하고, 스톱 로드 인자를 줄이는 방법과 같은 방법으로 위의 위험을 줄일 수 있습니다. 또한 거래 수수료가 낮은 브로커를 선택하는 것도 중요합니다.
최적화 방향
이 전략은 다음과 같은 측면에서 최적화될 수 있습니다.
- 다른 지표에 필터를 추가하여 최고의 출전 시간을 놓치지 않도록하십시오.
- ATR 주기 변수를 최적화
- 재입학제도에 가입하는 것을 고려하세요.
- 동적으로 조정된 중지량
- 트렌드 판단 규칙에 가입하여 역전 진출을 피하십시오.
요약하다
이 전략은 전체적으로 간단하고 실용적인 단선 돌파 평균선 역전 전략이다. 명확한 입점 규칙, 엄격한 스톱드 메커니즘, 그리고 완벽한 스톱드 방식이 있다. 또한 몇 가지 파라미터를 조정할 수 있는 최적화 공간을 제공한다. 거래자가 적절한 지표를 선택하고 스톱드를 사용하여 위험을 제어할 수 있다면, 이 전략은 좋은 효과를 얻을 수 있어야 한다.
Source
Pine
Strategy parameters
Related strategies
Comment
All comments (0)
No data
- 1