모멘텀 지표에 따른 추세 추종 거래 전략

1
Follow
1778
Followers
개요
이 전략은 역동적인 지표 RSI와 가격의 Exponential Moving Average (EMA) 와 Simple Moving Average (SMA) 를 기반으로 거래 신호를 구축합니다. 이것은 트렌드 추적 유형의 전략입니다.
전략 원칙
이 전략은 3가지 조건으로 거래 신호를 생성합니다.
- RSI > 45: RSI 값이 45 이상이면 좋은 구매 신호로 간주됩니다.
- EMA ((RSI) > SMA ((RSI): EMA 선이 SMA 선보다 크다는 것은 RSI가 상승 속도를 내고 있다는 것을 의미하며, 좋은 운동 신호입니다.
- EMA ((폐쇄 가격) > SMA ((폐쇄 가격): EMA 선이 SMA 선보다 크다는 것은 가격 추세가 가속화되고 있음을 나타냅니다.
위의 3가지 조건 중 임의의 2가지가 충족되면 구매 신호가 발생하고, 모두 충족되지 않으면 판매 신호가 발생한다.
이 전략은 동시에 항상 구매하는 모드를 제공하여 시스템 자체의 상대적인 대역의 성능을 테스트합니다.
전략적 강점 분석
- 동적 지표 RSI를 사용하여 시장 상황을 판단하여 시장의 흔들림 기간의 거래를 줄일 수 있습니다.
- EMA와 SMA의 추세 방향 판단과 결합하여 가격 변화의 동향을 적시에 잡을 수 있습니다.
- 조건 규칙은 간단하고 명확하며 이해하기 쉽고 최적화 가능합니다.
- <unk>은 항상 구매할 수 있습니다.
전략적 위험 분석
- 매개 변수 설정에 따라, 매개 변수가 잘못되면 거래가 빈번하게 이루어지거나 좋은 거래 기회를 놓치게 됩니다.
- 큰 소식이 있을 때, 단기간에 큰 가격 변동이 발생할 수 있으며, 이로 인해 손실이 발생할 수 있습니다.
- 전략 자체로는 트렌드 반전의 시점을 판단할 수 없으며, 다른 지표와 함께 판단해야 합니다.
최적화 방향
- RSI, EMA 및 SMA의 변수를 최적화하여 최적의 변수 조합을 찾습니다.
- <unk>, MACD 등 다른 기술 지표 판단 규칙을 추가
- 트렌드 반전 판단 지수를 늘리고 손실 가능성을 낮추는 것
요약하다
이 전략은 전체적으로 중장기 가격 동향을 포착하고 단기 시장의 변동을 피하기 위한 중장기 거래 전략에 속한다. 이 전략의 장점과 위험점은 모두 분명하다. 매개 변수 최적화 및 규칙 풍부 함으로써 전략의 안정성을 더욱 강화할 수 있으며, 깊이 연구하고 최적화할 가치가 있는 고효율 수치화 거래 전략이다.
Source
Pine
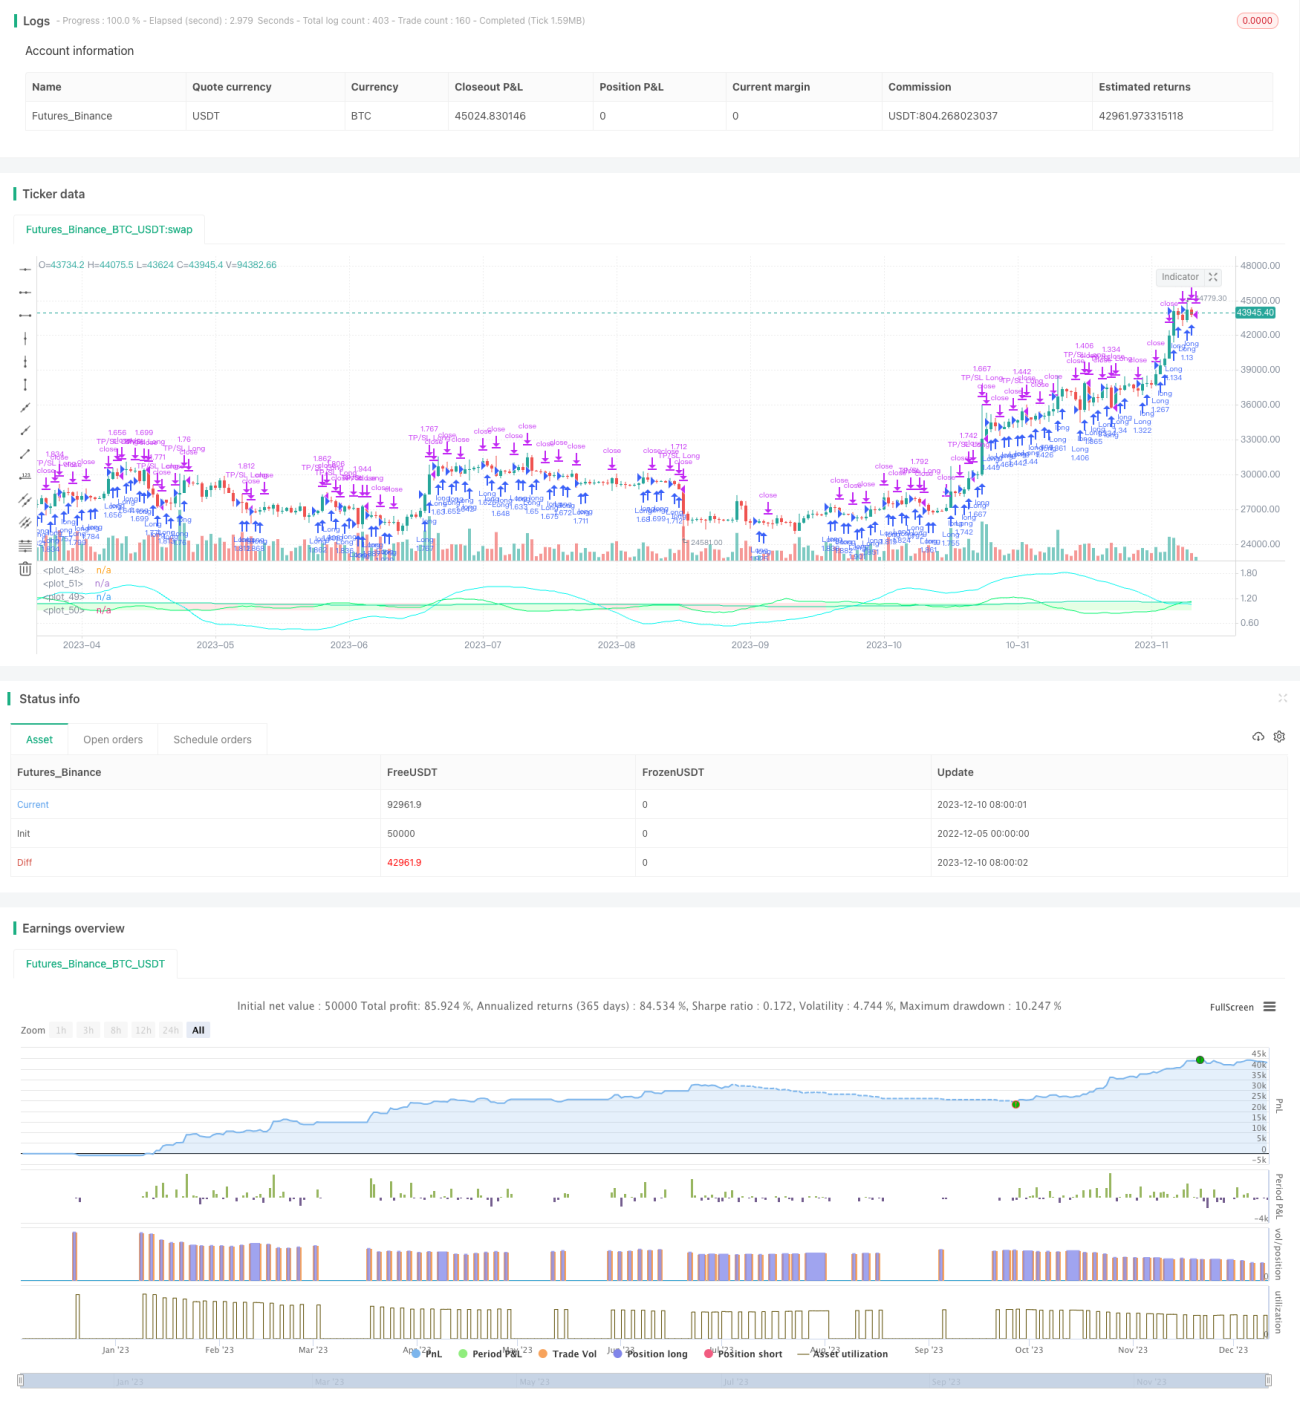
/*backtest
start: 2022-12-05 00:00:00
end: 2023-12-11 00:00:00
period: 1d
basePeriod: 1h
exchanges: [{"eid":"Futures_Binance","currency":"BTC_USDT"}]
*/

//@version=5
strategy("I11L Unitrend",overlay=false, initial_capital=1000000,default_qty_value=1000000,default_qty_type=strategy.cash,commission_type=strategy.commission.percent,commission_value=0.00)
tradingMode = input.string("Unitrend", "Trading Mode", ["Unitrend", "Always Buy"], tooltip="Choose the Trading Mode by trying Both in your Backtesting. I use it if one is far better then the other one.")
compoundingMode = input.bool(false)Strategy parameters
Related strategies
Comment
All comments (0)
No data
- 1