확률적 모멘텀 지수와 RSI를 기반으로 한 양적 전략

1
Follow
1778
Followers
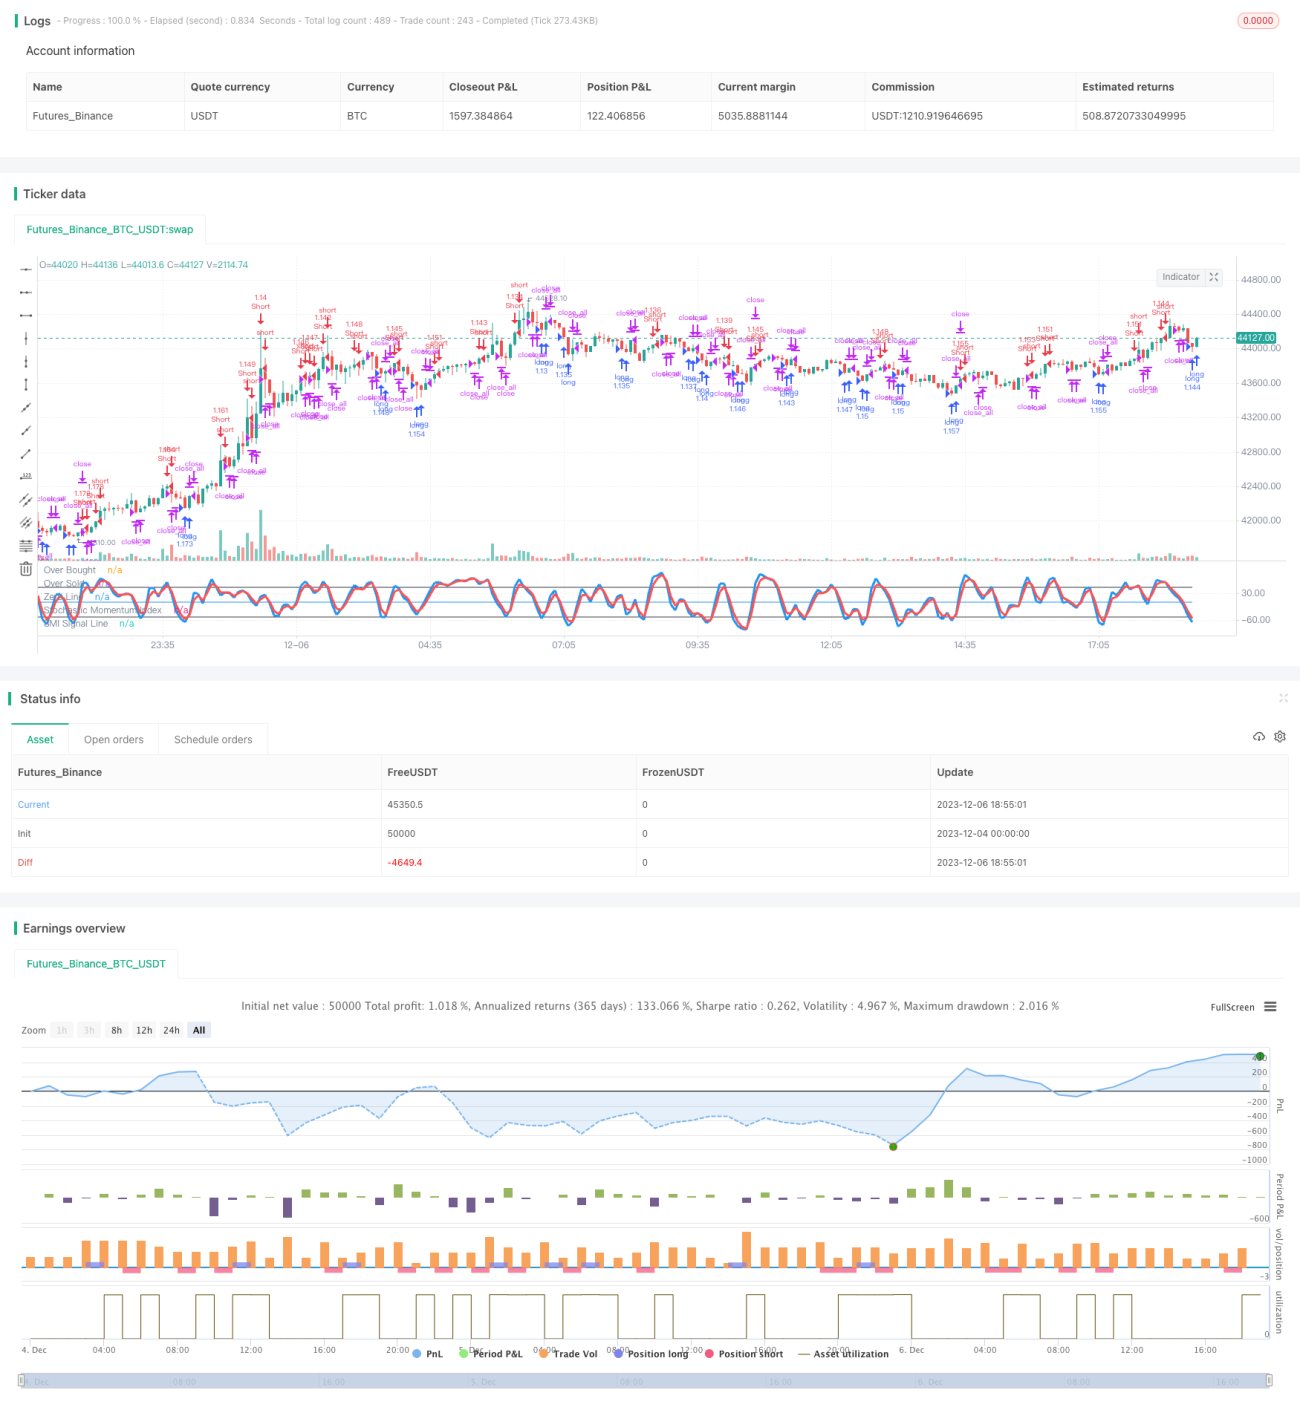
개요
이 전략은 주로 Stochastic Momentum Index (SMI) 와 상대적으로 강한 지수 (RSI) 를 기반으로 한다. 또한, 컬러 필터와 K선 엔티티 필터가 보조 판단 조건으로 추가되었다. SMI와 RSI 지표의 다공간 신호를 기반으로, 필터 조건과 결합하여 거래 신호를 발산한다. 이 전략은 시장의 단선 거래 기회를 효과적으로 발견할 수 있다.
전략 원칙
이 전략의 핵심은 SMI와 RSI의 두 지표에 의존하여 판단한다. SMI는 주가가 과매매되고 있는지 판단하고 RSI는 주가가 상대적으로 강하다는 판단을 한다. 둘 다 동시에 구매 신호를 주면 구매 작업을 수행한다. 구체적인 논리는 다음과 같습니다:
- SMI 과매매 (하위 하위), 구매 신호로 간주
- RSI가 하락하면 구매 신호입니다.
- SMI 과매매와 RSI가 동시 상대적 하위치보다 낮을 때 구매 신호를 발산합니다.
- 공허 신호 판단 논리 비슷한
또한, 이 전략은 이중 신호 모드를 설정한다. 이 모드는 SMI와 RSI가 동시에 신호를 내야 거래를 할 수 있다. 이것은 가짜 신호를 효과적으로 줄일 수 있다.
또한, 이 전략은 색상 필터와 K선 엔티티 필터를 추가한다. 이 두 필터는 K선 엔티티가 더 크도록 요구하며, 마지막 K선 엔티티의 종료 가격은 개시 가격보다 높다. 이것은 거래의 가짜 돌파구를 추가적으로 방지할 수 있다.
전략적 이점
- SMI를 사용하여 과매매를 판단하고 RSI 판단은 상대적으로 약하며, 이중 확인은 가짜 신호를 줄일 수 있습니다.
- 이중 신호 모드를 설정하여 유효하지 않은 거래를 크게 줄일 수 있습니다
- 컬러 필터와 K선 엔티티 필터는 가짜 돌파구를 효과적으로 필터링 할 수 있습니다.
- 전략 실행 논리는 명확하고 간단합니다.
- 대부분의 변수는 사용자 정의 가능합니다.
위험과 최적화
- SMI와 RSI가 개별 지표로 사용되면 더 많은 가짜 신호가 발생할 수 있으므로 주의해야 합니다.
- 이중 신호 모드에서, 변수가 잘못 설정되면, 더 좋은 거래 기회를 놓칠 수 있습니다.
- 다양한 주기적 변수 아래의 전략 수익 상황을 테스트할 수 있으며, 최적의 변수 조합을 찾습니다.
- 시뮬레이션 또는 재검토를 통해 특정 절댓값 매개 변수의 설정
- 더 많은 필터 최적화 전략을 고려할 수 있습니다.
요약하다
이 전략은 SMI와 RSI의 두 지표의 신호를 통합하여, 이중 확인을 통해 거래 지시문을 발송한다. 동시에 색 필터와 K선 엔티티 필터를 설정하면 가짜 돌파구를 필터링 할 수 있다. 이 전략의 운영 논리는 간단하고 명확하며, 대부분의 매개 변수를 사용자 정의 할 수 있다. 매개 변수를 조정하면 더 나은 전략 수익 성과를 얻을 수 있다.
Source
Pine
Strategy parameters
Related strategies
Comment
All comments (0)
No data
- 1