볼린저 밴드 듀얼 이동 평균 추적 그리드 전략

개요
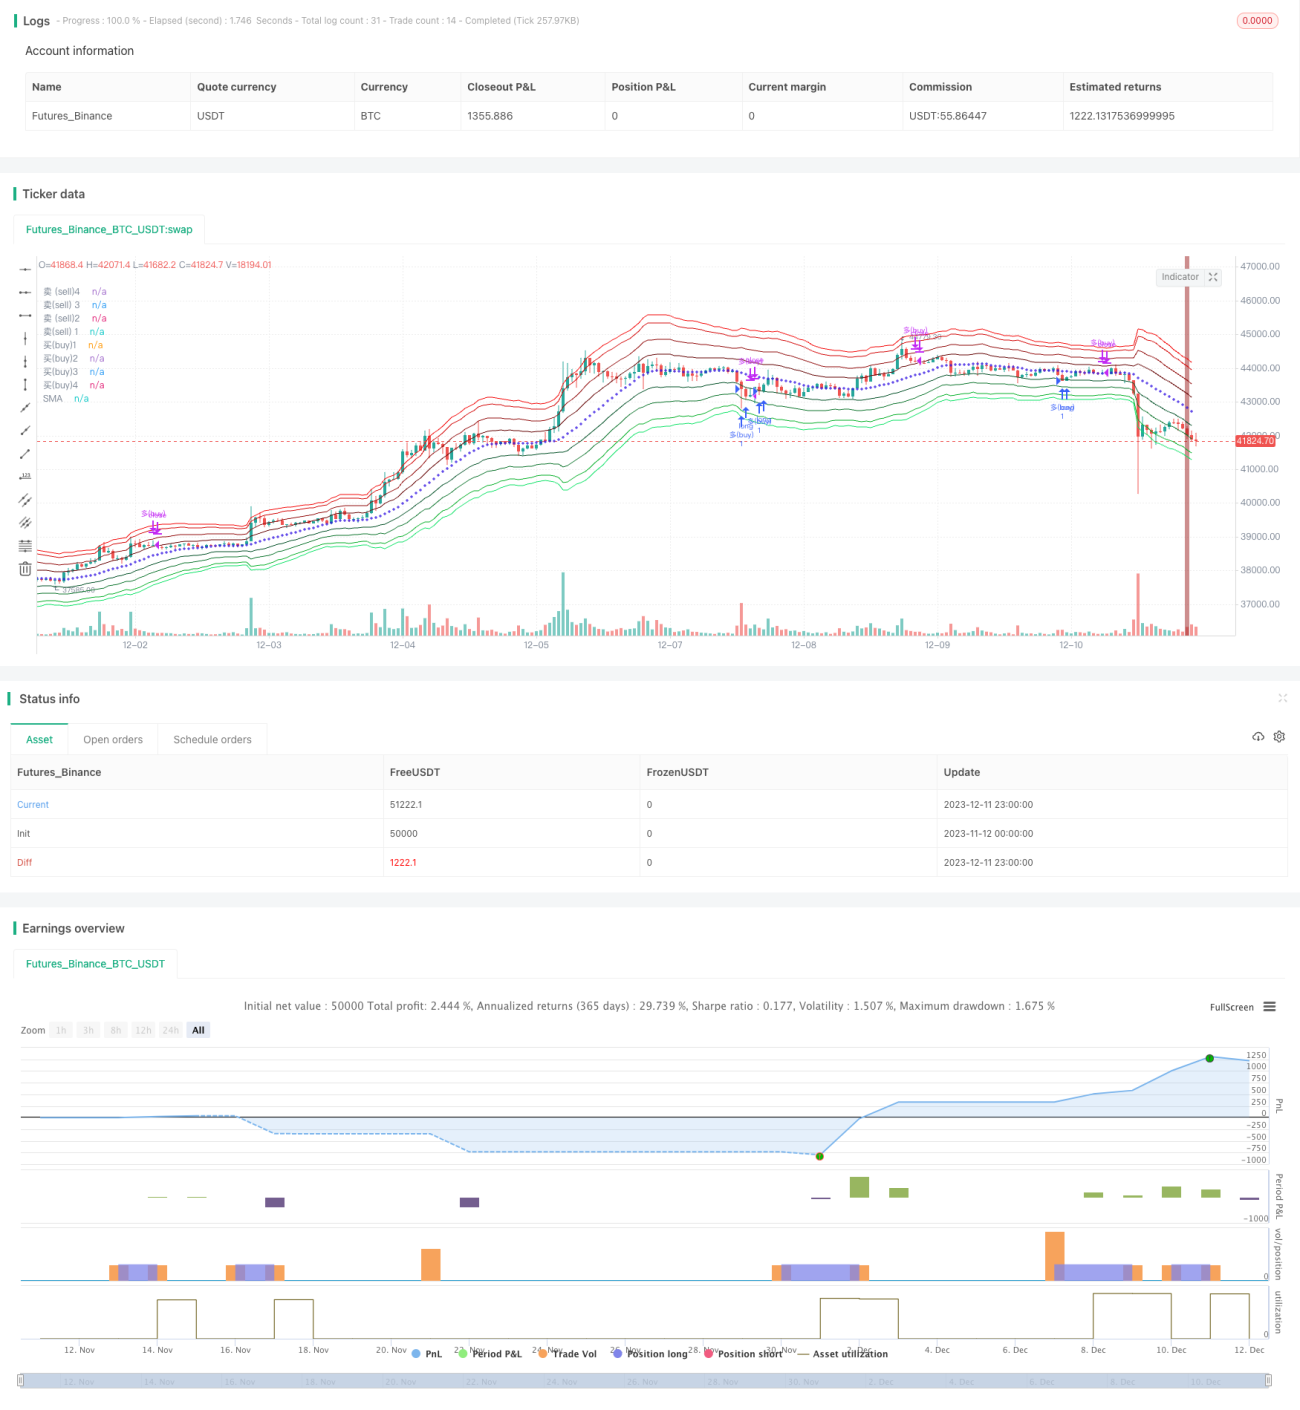
이 전략은 브린 채널 지표를 사용하여 ATR 및 피보나치 회귀를 기반으로 한 파장을 격자의 가격 채널로 나타냅니다. 쌍 EMA 평균선과 결합하여 전체적인 트렌드 방향을 판단하고, 트렌드 방향에서 브린 영역 가격에 선택적으로 추적 스톱 손실 격자를 설정하여 트렌드 추적 중개를 구현합니다.
전략 원칙
-
브린 통로의 중축과 ATR과 4개의 피보나치 회귀선을 기반으로 상하 궤도 구조 가격 파장을 그리기.
-
빠른 선 EMA와 느린 선 SMA는 쌍평평선으로 구성되어 전체 트렌드 방향을 판단한다. 빠른 선은 느린 선을 돌파하여 다단 시장, 반대로 공백 시장이다.
-
다단 시장에서 더만 하고, 부린 하단 궤도 근처의 가격 돌파 통로 아래를 따라 포지션을 더 많이 개시한다. 공백 시장에서 공백만 하고, 부린 상단 궤도 근처의 가격 돌파 통로 위에 포지션을 개시한다.
-
스톱 손실 조건을 설정: K 선의 급격한 반전으로 현재 방향의 포지션을 탈퇴하십시오.
우위 분석
-
이중평균선을 사용하여 대차 트렌드를 판단하고 역대 거래를 피하십시오.
-
부린 ATR 채널 격자는 여러 개시 가격을 설정하여 개시 성공률을 높였다.
-
피보나치 회귀 파장은 가격 분산도를 설정하고, 다른 파장의 포지션 수를 달리하여 자금 분산을 실현한다.
-
실시간 중단 조건은 신속한 중단과 수익 회귀를 줄여줍니다.
위험 분석
-
대차 트렌드 판단 오류는 역전 손실을 초래할 수 있다. 평균선 변수를 적절히 조정하거나, 다른 지표를 추가하여 보조 판단을 할 수 있다.
-
변동이 너무 커지면, 가격이 직접 격자 영역을 뚫고, 포지션을 열 수 없습니다. 포지션을 열 기회를 높이기 위해 파급 부문의 매개 변수를 조정할 수 있습니다.
-
스톱 로드 조건은 주관적이며, 다른 거래자의 식별 기준에는 오류가 있을 수 있다. 스톱 로드 조건을 테스트하고 최적화하는 것이 좋습니다.
최적화 방향
-
APO 지표에 이중평선 경향 판단을 위한 보조 분석을 추가한다.
-
시장의 변동률 지표를 사용하여 브린의 파동 변수를 최적화하여 시장의 역동적인 변화에 더 잘 적응합니다.
-
스톱마인드를 줄이고, OTHER 방식의 스톱 조건 설정으로 오류를 줄인다.
요약하다
이 전략의 전체적인 아이디어는 명확하고, 브린 ATR 채널과 쌍평등선과 결합하여 전략 거래 신호의 전체적 종합 판단을 구현하여, 잘못된 판단의 위험을 최대한 줄여줍니다. 전략의 장점은 분명하며, 실제적으로 적용할 수 있습니다. 그러나 매개 변수 설정 및 스톱 손실 조건과 같은 세부 사항은 여전히 최적화 할 여지가 있으며, 추가 개선이 필요합니다. 지속적인 최적화 과정에서 이 전략의 수익 수준과 안정성이 지속적으로 향상 될 것으로 믿습니다.
- 1