이중 역전 트렌드 추적 전략

저자:차오장, 날짜: 2023-12-13 18:01:53
태그:

img

전반적인 설명

이 트렌드 추적 전략은 이중 반전 신호를 결합합니다. 더 신뢰할 수있는 트렌드 판단을 위해 가격 반전 지점을 추적하기 위해 123 반전 전략과 성능 지표 전략을 통합합니다.

전략 원칙

이 전략은 두 가지 하위 전략으로 구성됩니다.

  1. 123 역전 전략

    역전 신호를 판단하기 위해 14일 K선을 사용하십시오. 구체적인 규칙은:

    • 상승 신호: 종료 가격은 전날 두 일 동안 하락했습니다. 현재 K 라인 종료 가격은 전날 종료 가격보다 높습니다. 9일 스토카스틱 슬로우는 50보다 낮습니다.
    • 하향 신호: 지난 2 일 동안 폐쇄 가격이 상승했습니다. 현재 K 라인 폐쇄 가격은 전날의 폐쇄 가격보다 낮습니다. 9 일 스토카스틱 패스트는 50보다 높습니다.
  2. 성과 지수 전략

    지난 14일 동안의 증가/감소 비율을 지표로 계산합니다. 규칙은 다음과 같습니다.

    • 성능 지수 > (0), 상승 신호를 생성 - 성능 지수 <(0), 하락 신호를 생성

최종 신호는 두 신호의 조합입니다. 즉, 실제 구매/판매 거래를 생성하기 위해 같은 방향의 상승/하락 신호가 필요합니다.

이렇게 하면 소음을 필터링하여 신호를 더 신뢰할 수 있습니다.

전략 의 장점

이 이중 역전 시스템은 다음과 같은 장점을 가지고 있습니다.

  1. 더 신뢰할 수 있는 신호 두 가지 요소를 결합
  2. 시장 소음을 효과적으로 필터링하고 잘못된 신호를 피할 수 있습니다.
  3. 123 패턴은 고전적이고 실용적이며 판단하고 재생하기 쉽습니다
  4. 성과 지수는 미래 트렌드 방향을 판단 할 수 있습니다.
  5. 유연한 매개 변수 조합, 더 이상 최적화 될 수 있습니다

전략 의 위험

이 전략은 또한 몇 가지 위험을 안고 있습니다.

  1. 갑작스러운 역전 현상을 놓칠 수 있고, 트렌드를 완전히 파악할 수 없습니다.
  2. 이중 신호 조합으로 인해 신호가 줄어들기 때문에 수익성에 영향을 줄 수 있습니다.
  3. 일관성 있는 판단이 필요하고, 개별적인 재고 변동에 쉽게 영향을 받습니다.
  4. 매개 변수 설정 문제로 인해 신호 오차가 발생할 수 있습니다.

최적화를 위해 다음 측면을 고려할 수 있습니다:

  1. K-선 길이가, 스토카스틱 사이클 등과 같은 매개 변수를 조정합니다.
  2. 이중 신호 판단을 위한 논리를 최적화
  3. 부피와 같은 더 많은 요소를 포함합니다.
  4. 스톱 손실 메커니즘을 추가합니다.

요약

이 전략은 가격 전환점을 효과적으로 발견하기 위해 이중 역전 판단을 통합합니다. 신호 발생 확률이 감소하지만 신뢰도는 높으며 중장기 트렌드를 포착하기에 적합합니다. 전략 효과는 매개 변수 조정 및 다중 요소 최적화로 더욱 향상 될 수 있습니다.


/*backtest
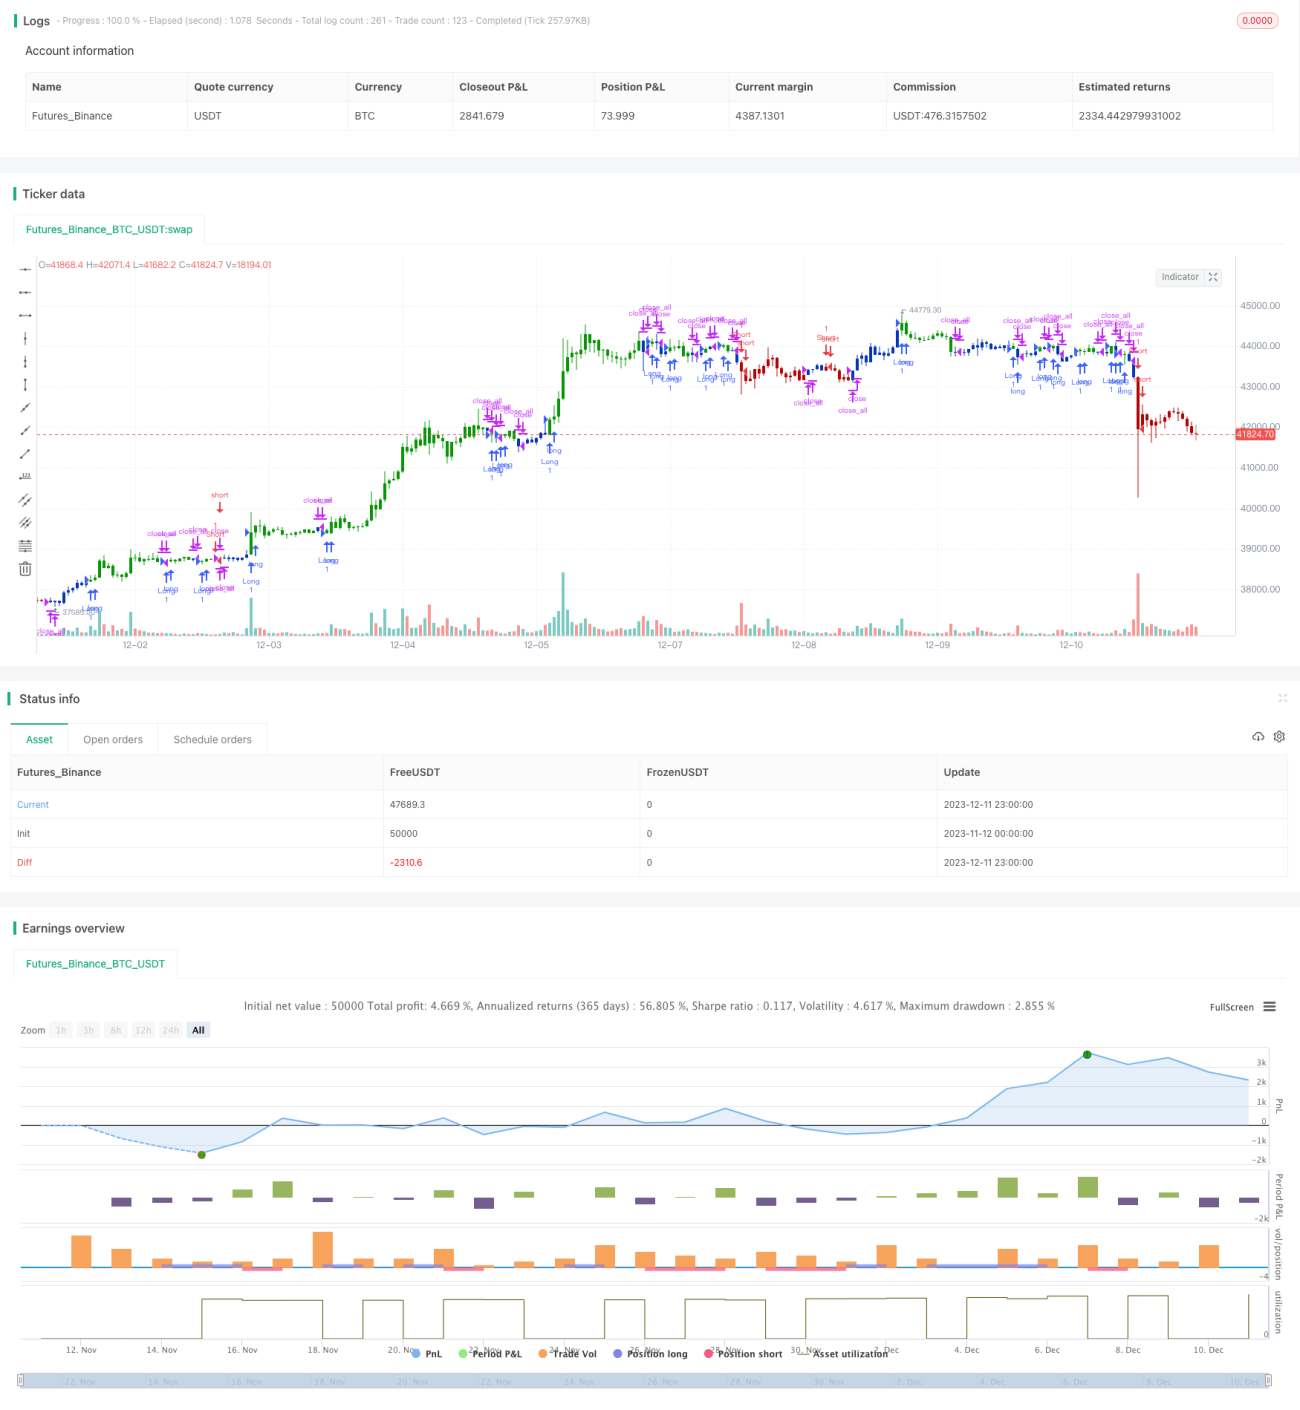
start: 2023-11-12 00:00:00
end: 2023-12-12 00:00:00
period: 1h
basePeriod: 15m
exchanges: [{"eid":"Futures_Binance","currency":"BTC_USDT"}]
*/

//@version=4
////////////////////////////////////////////////////////////
//  Copyright by HPotter v1.0 15/04/2021
// This is combo strategies for get a cumulative signal. 
//
// First strategy
// This System was created from the Book "How I Tripled My Money In The 
// Futures Market" by Ulf Jensen, Page 183. This is reverse type of strategies.
// The strategy buys at market, if close price is higher than the previous close 
// during 2 days and the meaning of 9-days Stochastic Slow Oscillator is lower than 50. 
// The strategy sells at market, if close price is lower than the previous close price 
// during 2 days and the meaning of 9-days Stochastic Fast Oscillator is higher than 50.
//
// Second strategy
// The Performance indicator or a more familiar term, KPI (key performance indicator), 
// is an industry term that measures the performance. Generally used by organizations, 
// they determine whether the company is successful or not, and the degree of success. 
// It is used on a business’ different levels, to quantify the progress or regress of a 
// department, of an employee or even of a certain program or activity. For a manager 
// it’s extremely important to determine which KPIs are relevant for his activity, and 
// what is important almost always depends on which department he wants to measure the 
// performance for.  So the indicators set for the financial team will be different than 
// the ones for the marketing department and so on.
//
// Similar to the KPIs companies use to measure their performance on a monthly, quarterly 
// and yearly basis, the stock market makes use of a performance indicator as well, although 
// on the market, the performance index is calculated on a daily basis. The stock market 
// performance indicates the direction of the stock market as a whole, or of a specific stock 
// and gives traders an overall impression over the future security prices, helping them decide 
// the best move. A change in the indicator gives information about future trends a stock could 
// adopt, information about a sector or even on the whole economy. The financial sector is the 
// most relevant department of the economy and the indicators provide information on its overall 
// health, so when a stock price moves upwards, the indicators are a signal of good news. On the 
// other hand, if the price of a particular stock decreases, that is because bad news about its 
// performance are out and they generate negative signals to the market, causing the price to go 
// downwards. One could state that the movement of the security prices and consequently, the movement 
// of the indicators are an overall evaluation of a country’s economic trend.
//
// WARNING:
// - For purpose educate only
// - This script to change bars colors.
////////////////////////////////////////////////////////////
Reversal123(Length, KSmoothing, DLength, Level) =>
    vFast = sma(stoch(close, high, low, Length), KSmoothing) 
    vSlow = sma(vFast, DLength)
    pos = 0.0
    pos := iff(close[2] < close[1] and close > close[1] and vFast < vSlow and vFast > Level, 1,
	         iff(close[2] > close[1] and close < close[1] and vFast > vSlow and vFast < Level, -1, nz(pos[1], 0))) 
	pos


PI(Period) =>
    pos = 0.0
    xKPI = (close - close[Period]) * 100 / close[Period]
    pos := iff(xKPI > 0, 1,
              iff(xKPI < 0, -1, nz(pos[1], 0))) 
    pos

strategy(title="Combo Backtest 123 Reversal & Perfomance index", shorttitle="Combo", overlay = true)
line1 = input(true, "---- 123 Reversal ----")
Length = input(14, minval=1)
KSmoothing = input(1, minval=1)
DLength = input(3, minval=1)
Level = input(50, minval=1)
//-------------------------
line2 = input(true, "---- Perfomance index ----")
Period = input(14, minval=1)
reverse = input(false, title="Trade reverse")
posReversal123 = Reversal123(Length, KSmoothing, DLength, Level)
posPI = PI(Period)
pos = iff(posReversal123 == 1 and posPI == 1 , 1,
	   iff(posReversal123 == -1 and posPI == -1, -1, 0)) 
possig = iff(reverse and pos == 1, -1,
          iff(reverse and pos == -1 , 1, pos))	   
if (possig == 1 ) 
    strategy.entry("Long", strategy.long)
if (possig == -1 )
    strategy.entry("Short", strategy.short)	 
if (possig == 0) 
    strategy.close_all()
barcolor(possig == -1 ? #b50404: possig == 1 ? #079605 : #0536b3 )

더 많은