
1
Follow
1778
Followers
개요
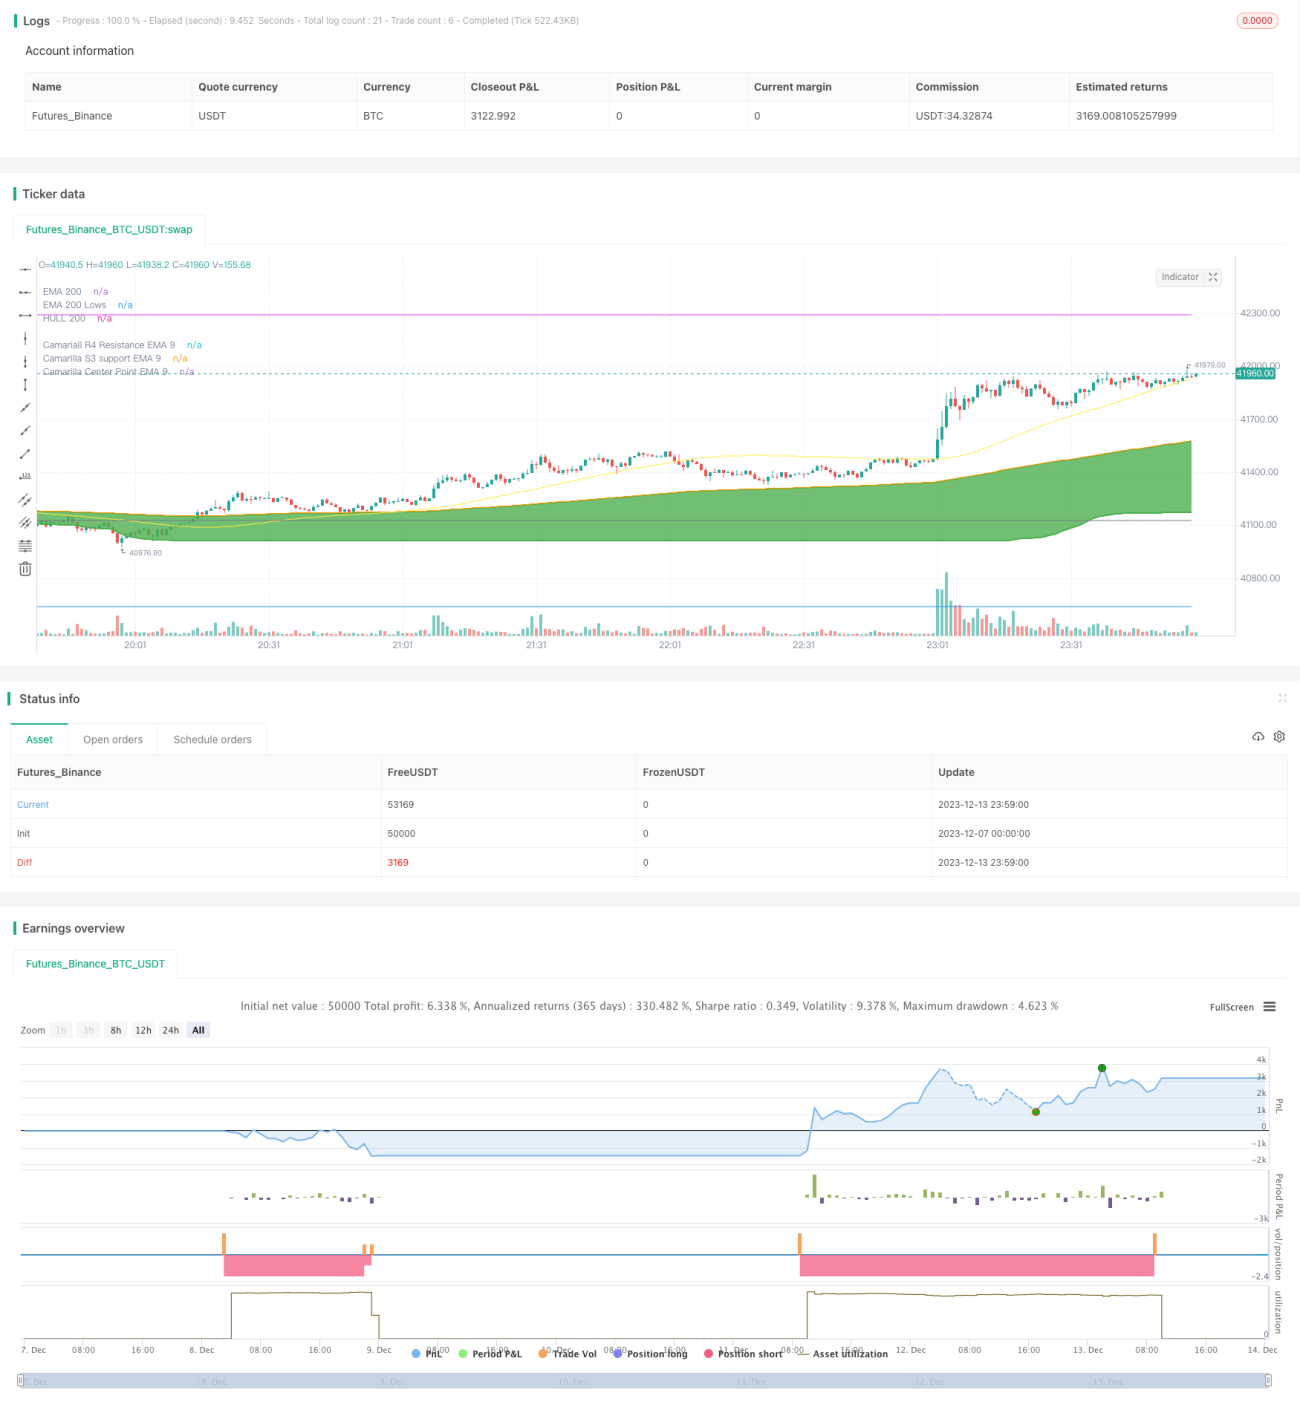
이 전략은 시장의 최저점을 기반으로 역전 작업을 수행하는 전략이다. 그것은 200일 EMA의 최저점을 이용하고, 카마렐라 지지부진의 저항점을 결합하여 시장의 최저점을 판단하고, 가격이 반발할 때 더 많은 작업을 수행한다.
전략 원칙
- 200일 EMA의 최저값인 EMA200Lows를 계산하고, 가격이 이 EMA보다 낮게 닫힐 때, 시장 최저점 근처에 있다고 본다.
- 카마렐라 지지 3 ((S3) 의 9일 EMA 즉 ema_s3_9를 계산하여 중요한 지지 지점으로 꼽는다.
- 카마렐라 중심의 9일 EMA를 계산해, 역전 신호를 판별하기 위해 사용한다.
- ema_center_9에 ema200Lows를 착용하고, 전 3개의 K선 모두 ema200Lows보다 낮으면, 여러 작업을 수행한다.
- ATR로 중지하고 최저 가격 이동을 추적합니다.
- 목표 수익은 ema_h4_9 ((카마렐라 저항 4) 과 ema_s3_9 ((카마렐라 지지 3) 였다.
우위 분석
- 200일 EMA 최저점을 사용하여 시장의 최저 지역을 판단하여 중간에서 더 낮은 점이 발생하지 않도록하십시오.
- 카마렐라 지각은 중심과 결합되어 역점을 더 정확하게 판단할 수 있다.
- ATR의 손해배상 방식은 더 합리적인 손해를 줄 수 있고, 더 낮은 지점을 추적하는 것이 더 유리하며, 더 많은 수익을 창출할 수 있습니다.
위험 분석
- 장기간 지분을 유지하는 것은 위험하다. 이 전략은 단선 운영에 더 적합하다.
- 대시장 상황에서는 스톱 손실이 더 커질 수 있다. ATR 파라미터에 따라 조정할 수 있다.
- 카마렐라 역설은 100% 신뢰할 수 있는 것은 아니며, 잘못된 판단이 있을 수 있습니다.
최적화 방향
- RSI와 같은 다른 지표와 결합하여 반전 신호를 판단할 수 있다.
- 다양한 품종의 변수를 조정하여 더 좋은 변수를 찾아볼 수 있다.
- 기계 학습 방법을 시도해 볼 수 있습니다. 동적으로 ATR을 조정할 수 있습니다.
요약하다
이 전략은 EMA 최저점과 카마렐라 지표를 사용하여 시장 최저 지역과 역점을 판단한다. ATR을 통해 손실을 멈추고 이익을 얻는다. 전체적으로 전략은 완전하고 실제 전쟁 가치가 있다. 후기에는 추가적인 최적화를 통해 전략을 더 안정적으로 신뢰할 수 있다.
Source
Pine
/*backtest
start: 2023-12-07 00:00:00
end: 2023-12-14 00:00:00
period: 1m
basePeriod: 1m
exchanges: [{"eid":"Futures_Binance","currency":"BTC_USDT"}]
*/

// This source code is subject to the terms of the Mozilla Public License 2.0 at https://mozilla.org/MPL/2.0/
// © mohanee

//Using the lowest of low of ema200, you can find the bottomStrategy parameters
Related strategies
Comment
All comments (0)
No data
- 1